USDCNH Analysis – 3-June-2024
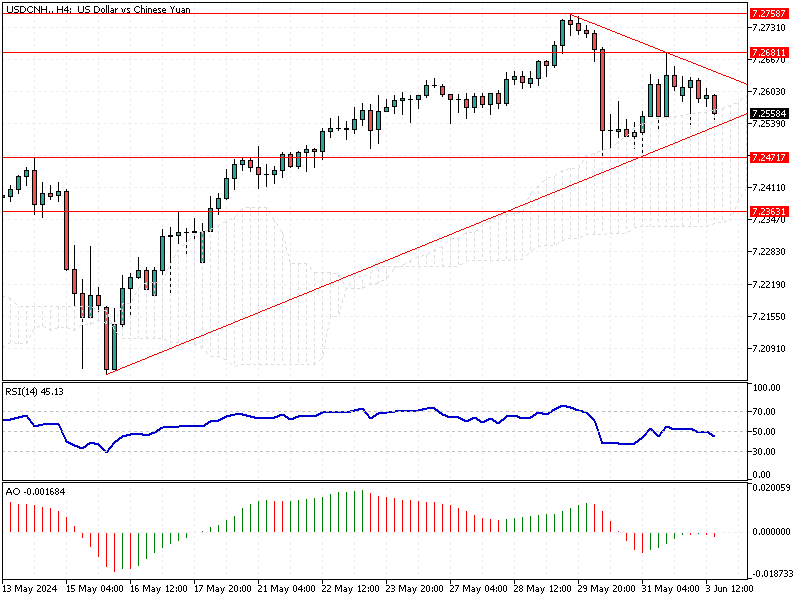
In today’s trading session, the USD/CNH currency pair trades around $7.25, exhibiting a sideways movement within a symmetrical triangle pattern. This pattern, often indicating a potential breakout, has approached its apex over the past three trading sessions.
Currently, the bears are testing the ascending trendline, a crucial level supported by the Ichimoku cloud, a reliable indicator of future price movements.
USDCNH Analysis – 3-June-2024
USDCNH Analysis – 3-June-2024
Technical indicators suggest an increase in bearish momentum. If the USD/CNH dips below $7.255, the next support level to watch is $7.247. The Ichimoku cloud reinforces this level, hinting at a possible price bounce. However, traders should remain vigilant, as the price action around the symmetrical triangle is critical. Should selling pressure break the key support level at $7.245, the next bearish target is $7.236.
Bullish Scenario
Conversely, the primary trend remains bullish. The price must close above the immediate resistance at $7.26 for the bullish trend to continue. Achieving this would set the next bullish target at the May all-time high of $7.275.
Traders and investors should closely monitor these critical levels to make informed decisions. Understanding these technical signals can help navigate the market effectively, ensuring preparedness for bullish and bearish scenarios.