NZDUSD Analysis – 3-June-2024
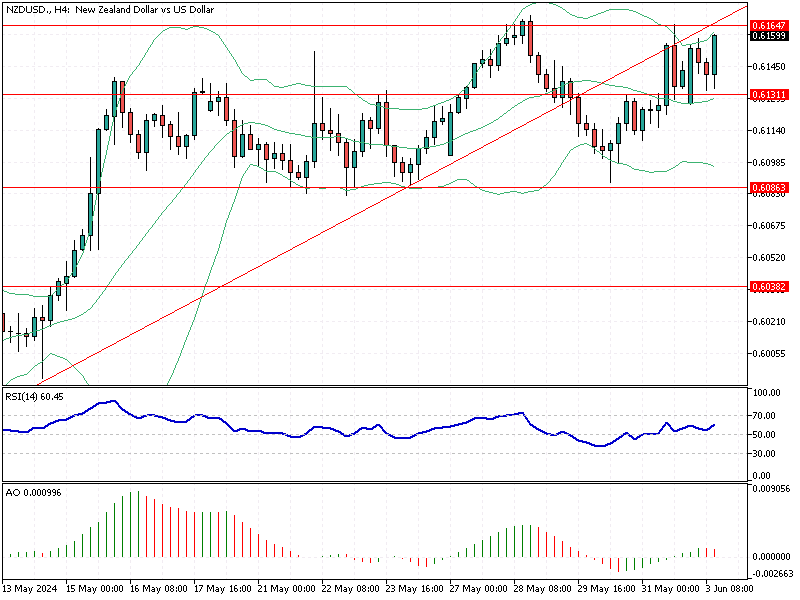
The NZD/USD currency pair has shown some significant movements that traders should note. Recently, the pair bounced from its immediate support level at $0.613 and is now testing the broken ascending trendline at a critical resistance level of $0.616.
NZDUSD Analysis – 3-June-2024
NZD/USD Sideways Market with Bullish Potential
The technical indicators currently suggest a sideways market with a mild bullish trend. The Relative Strength Index (RSI) is positioned at 60, above the median line. This indicates that while the market is not overbought, it has the potential to maintain its upward momentum around the key resistance, aiming for a possible breakout.
Another crucial technical indicator, the Awesome Oscillator, shows red bars. Despite this, the bars remain above the zero line, suggesting that the bullish momentum may weaken but is not entirely exhausted.
Bullish Scenario
From a technical standpoint, the $0.616 resistance level is crucial as it halted the primary upward trend. The NZD/USD must close and stabilize above this level for the uptrend to continue. If this scenario occurs, traders can set the next bullish target at $0.621.
Bearish Scenario
However, if the bulls cannot overcome the $0.616 resistance, the currency pair is likely to decline again, targeting the immediate support at $0.613. Should selling pressure increase further, the next support level to watch would be $0.6086.
Summary
For traders, this analysis highlights the importance of the $0.616 resistance level in determining the future direction of the NZD/USD pair. A successful breakout above this level could pave the way for further gains, while failure might signal a return to lower support levels.