NZDUSD Technical Analysis – 7-June-2024
The NZD/USD currency pair has been bullish, as evidenced by the recent price movements on the 4-hour chart. However, the pair is consolidating near a significant resistance level at $0.621, indicating a potential pause or reversal in the uptrend.
NZDUSD Technical Analysis – 7-June-2024
Price Action and Key Levels
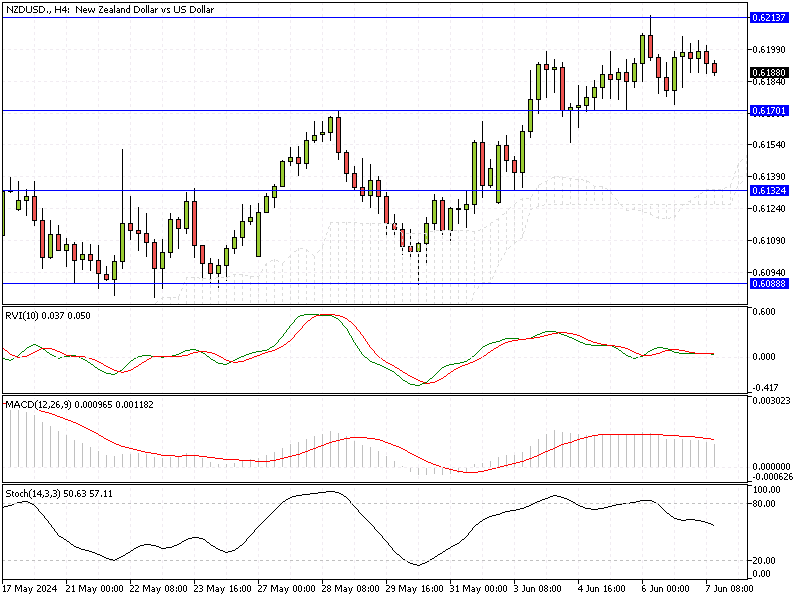
The chart shows the NZD/USD pair trading within a range of about $0.618 after a strong upward move. The key resistance level to watch is at 0.6213, which has been tested multiple times but not yet breached. The immediate support level lies at 0.617, with another significant support at 0.6132.
The pair’s ability to break through these levels will determine its next movement phase.
Relative Vigor Index (RVI)
The Relative Vigor Index (RVI) currently shows a value of 0.038, slightly above the signal line at 0.050. This suggests that while there is bullish momentum, it is not very strong. A crossover above the signal line would indicate a strengthening of bullish momentum, whereas a continuation below could signal a bearish reversal.
Moving Average Convergence Divergence (MACD)
The MACD indicator further illustrates the weakening bullish momentum. The MACD line converges towards the signal line, and the histogram shows decreasing positive values. This convergence hints at a possible bearish crossover, leading to a short-term pullback or consolidation phase.
Stochastic Oscillator
The Stochastic Oscillator is in the neutral zone, with the %K line at 51.45 and the %D line at 57.38. This suggests that the market is neither overbought nor oversold. However, the oscillator’s downward trend indicates a potential shift toward bearish sentiment if the %K line crosses below the %D line.
NZDUSD Forecast – 7-June-2024
The current consolidation near the resistance level of 0.6213 suggests that the pair might either break out for a continued bullish run or pull back toward support levels. Traders should watch for a clear breakout above 0.621 for bullish confirmation, while a break below 0.617 could signal the start of a bearish phase.
The technical indicators show signs of weakening momentum, so caution is advised for bullish trades.