EURUSD Analysis – 3-June-2024
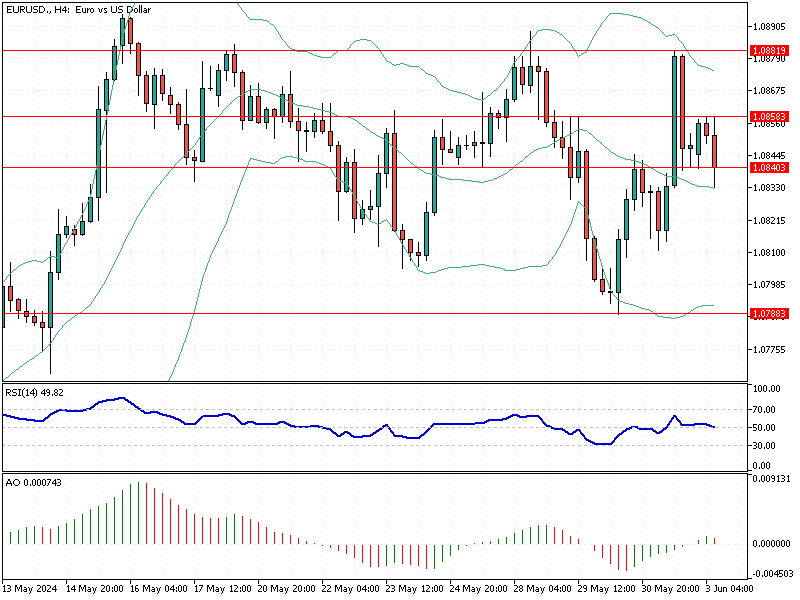
The EUR/USD exchange rate has recently experienced a decline from the $1.088 ceiling and is currently trading around $1.084, testing the high from May 30. This fluctuation is crucial for forex trading, providing insights into the market’s current state and potential future movements.
EURUSD Analysis – 3-June-2024
EURUSD Analysis 4-Hour Chart
Technical indicators are giving mixed signals, adding complexity to the analysis. The Relative Strength Index (RSI) hovers around the median line, indicating a market with low momentum. This suggests that neither buyers nor sellers have a distinct advantage.
Another key indicator, the Awesome Oscillator, has recently turned red. This color change signals that bearish momentum might resume, suggesting a possible downward trend.
The immediate resistance level to watch is $1.085. If the EUR/USD price remains below this level, a further decline towards the May 30 low of $1.078 is likely.
Bullish Scenario
On the other hand, if bullish traders push the price above the $1.085 resistance, the upward trend that began on May 30 may continue, potentially surpassing the critical resistance level at $1.088.
Traders should closely monitor these indicators and resistance levels to make informed decisions. Understanding these technical signals can help anticipate market movements and adjust trading strategies accordingly.