USDJPY Analysis – November-27-2023
In today’s USDJPY technical analysis, we examine the pair on the 4-hour chart, employing price action techniques alongside two widely used indicators.
Nikkei 225 Index Experiences a Drop
In Tokyo’s stock market on Monday, the Nikkei 225 Index witnessed a notable decrease, falling by 312 points, translating to a loss of 0.93 percent. This downturn marks a significant shift in the market’s dynamics at the start of the week.
Among the significant contributors to this decline were several vital companies. Mitsubishi Heavy Industries saw the most significant drop, falling by 5.05%. This was closely followed by CyberAgent, which decreased by 3.85%, and Sumitomo Metal Mining, which had a 3.74% loss.
Despite the overall downward trend, some companies managed to record gains. Credit Saison led the pack with a 2.58% increase, followed by KAO with a 2.53% rise, and Sumco, which saw its stock increase by 2.39%.
USDJPY Analysis
The USDJPY pair has been unable to maintain its price below the 23.6% Fibonacci retracement level. The 4-hour chart has formed a bullish candlestick pattern characterized by a long wick. While the Relative Strength Index (RSI) continues to hover below the 50 line, the Awesome Oscillator’s histogram has turned green, suggesting the potential continuation of the bullish trend.
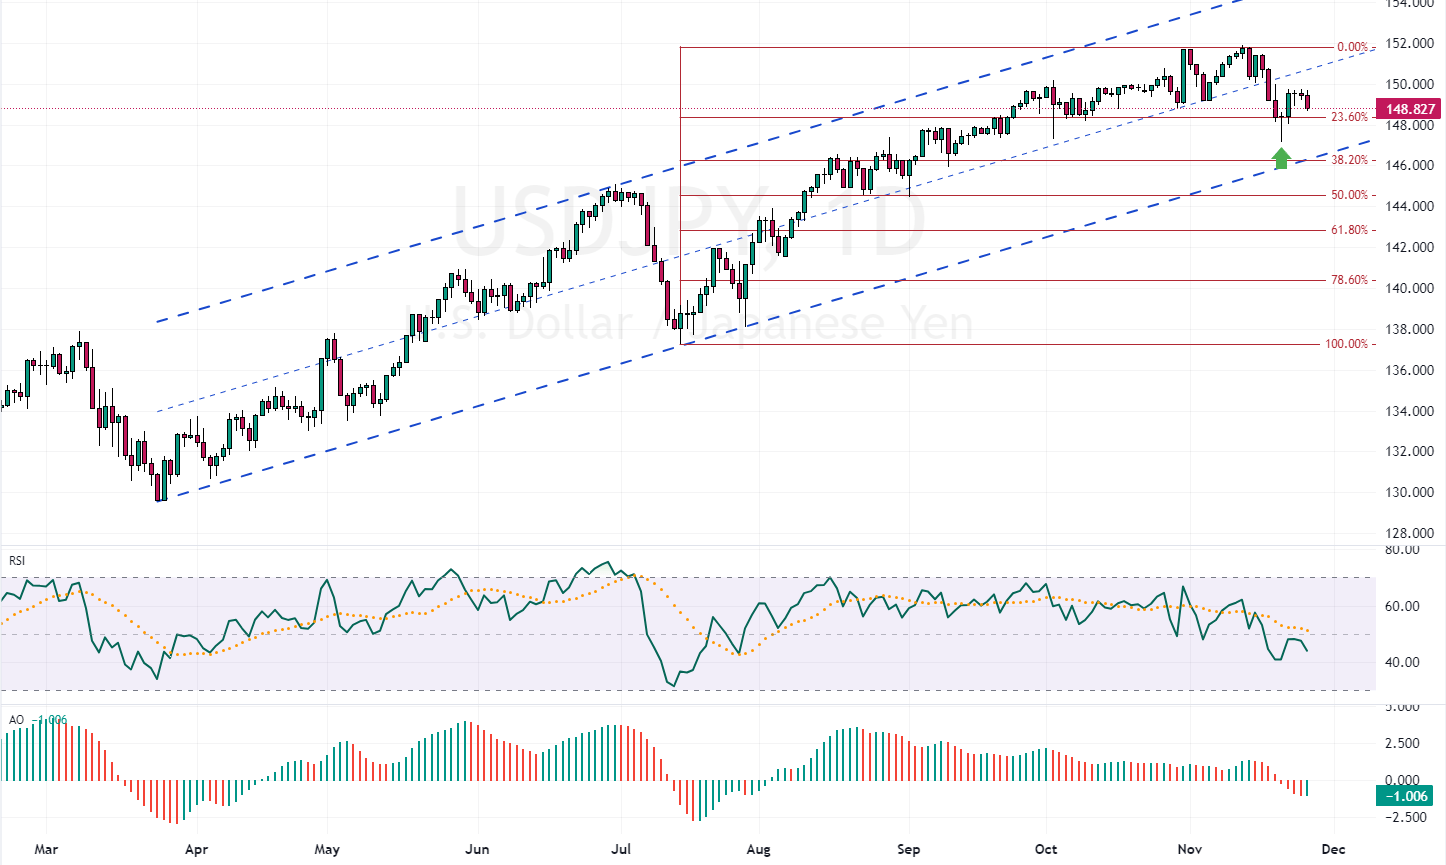
USDJPY Technical Analysis – 4H Chart
The 38.2% Fibonacci retracement level underpins the bullish scenario. If this level holds, the initial target for the bulls could be the October high, around 152.0. However, should this level be breached, the bullish scenario would become invalid.