USDJPY Analysis -December-22-2023
The currency pair experienced a significant drop after reaching the Ichimoku cloud. Presently, it’s trading beneath a resistance level outlined by the cloud. Observing the 4-hour USDJPY chart clarifies the situation; The price steadily declines within the bearish flag. Currently, the pair is challenging the 78.6% Fibonacci support level.
Given the current technical indicators, it seems probable that this support level may be broken, indicating an ongoing bearish trend.
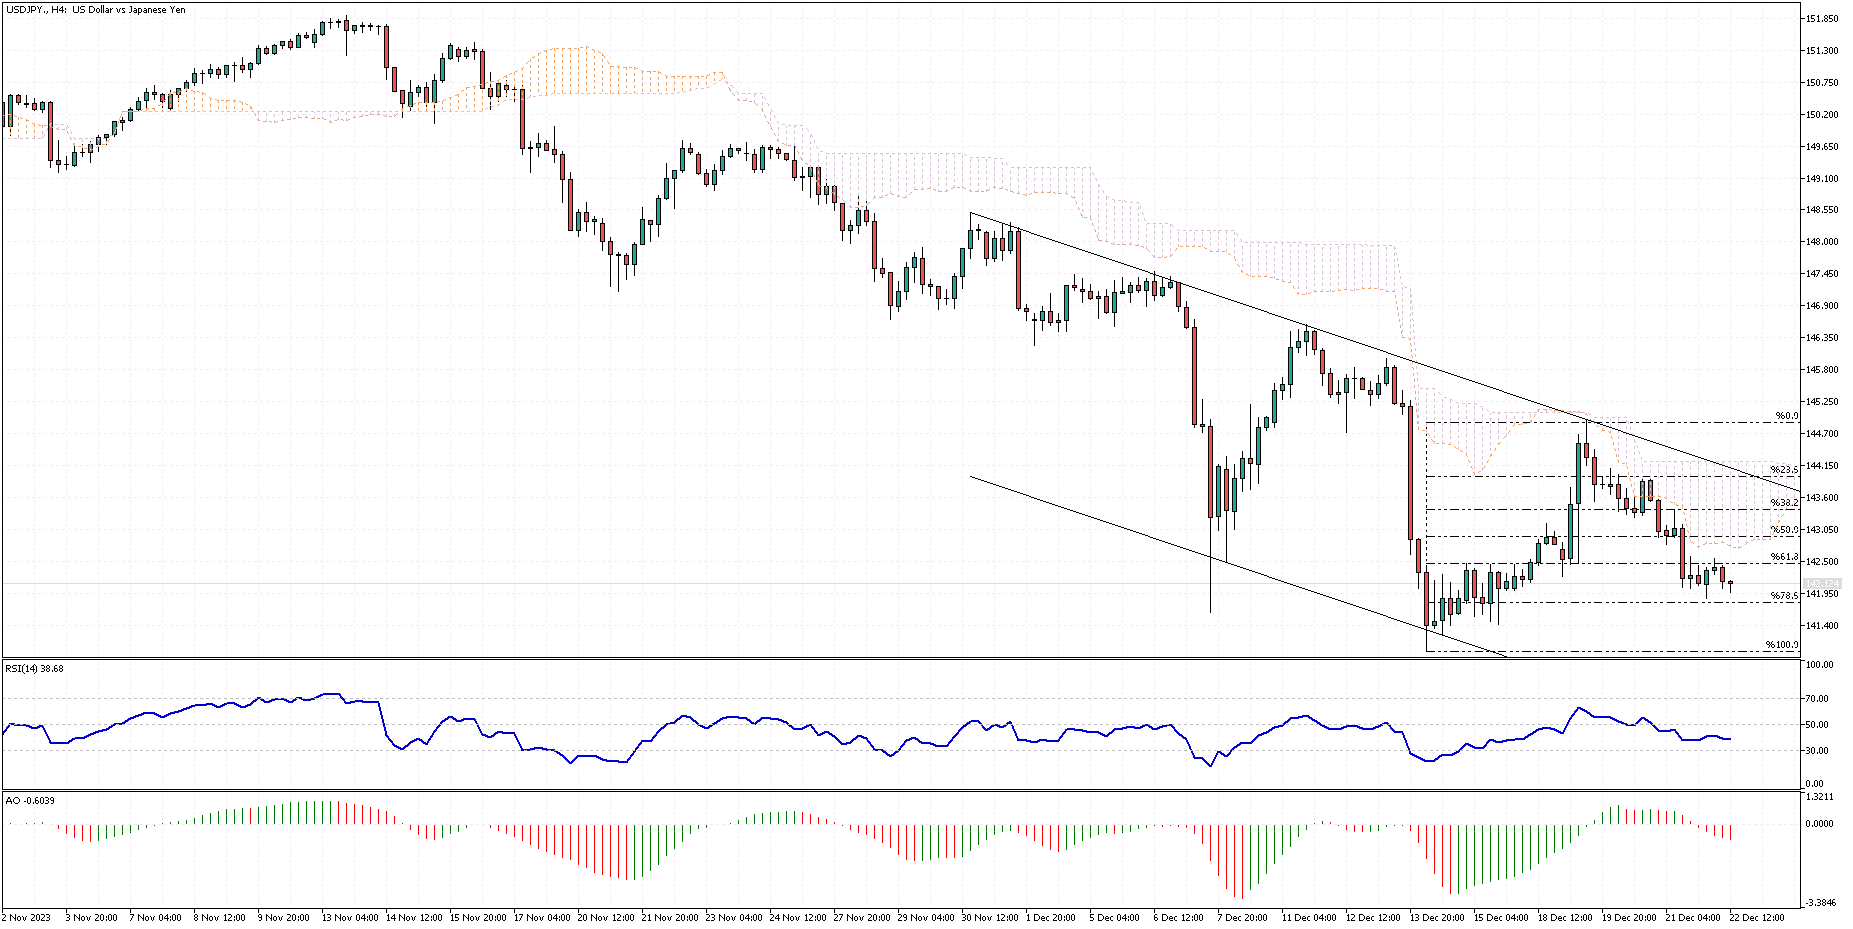
USDJPY Technical Analysis – 4H Chart
USDJPY Analysis: Japan Bond Yields Rise Again
Reuters – Japan’s 10-year government bond yield climbed past 0.6%, recovering from recent lows. This change comes as investors reevaluate the global economic and interest rate climate.
Recent statistics indicate a decrease in Japan’s inflation rates to 16-month lows of 2.8% for the headline rate and 2.5% for the core rate in November. However, the core rate remains above the central bank’s 2% target for the twentieth month. Japan’s bond yields dropped when the Bank of Japan (BOJ) decided to continue its accommodating monetary policy without hinting at future changes.
BOJ Governor Kazuo Ueda, in a recent press conference, suggested a willingness to implement further easing if needed, taking a more cautious approach than anticipated.