NZDUSD Analysis – December-14-2023
The NZDUSD currency pair has risen above its November high and is testing a critical resistance level. This zone, ranging from 0.6207 to 0.6204, coincides with the 23.6% Fibonacci support level. Presently, the NZDUSD is exhibiting a bullish trend. However, it’s important to note that the RSI indicator is approaching the overbought territory. This suggests that the pair might soon face selling pressure. As a result, there’s a possibility that it could retest the 50% Fibonacci support level. This area could serve as a vital entry point for buyers.
Conversely, if the NZDUSD does not decline in upcoming trading sessions, the 38% Fibonacci level becomes significant. Should the price remain above 38.2%, it would be a strategic move to enter the market with a bullish perspective.
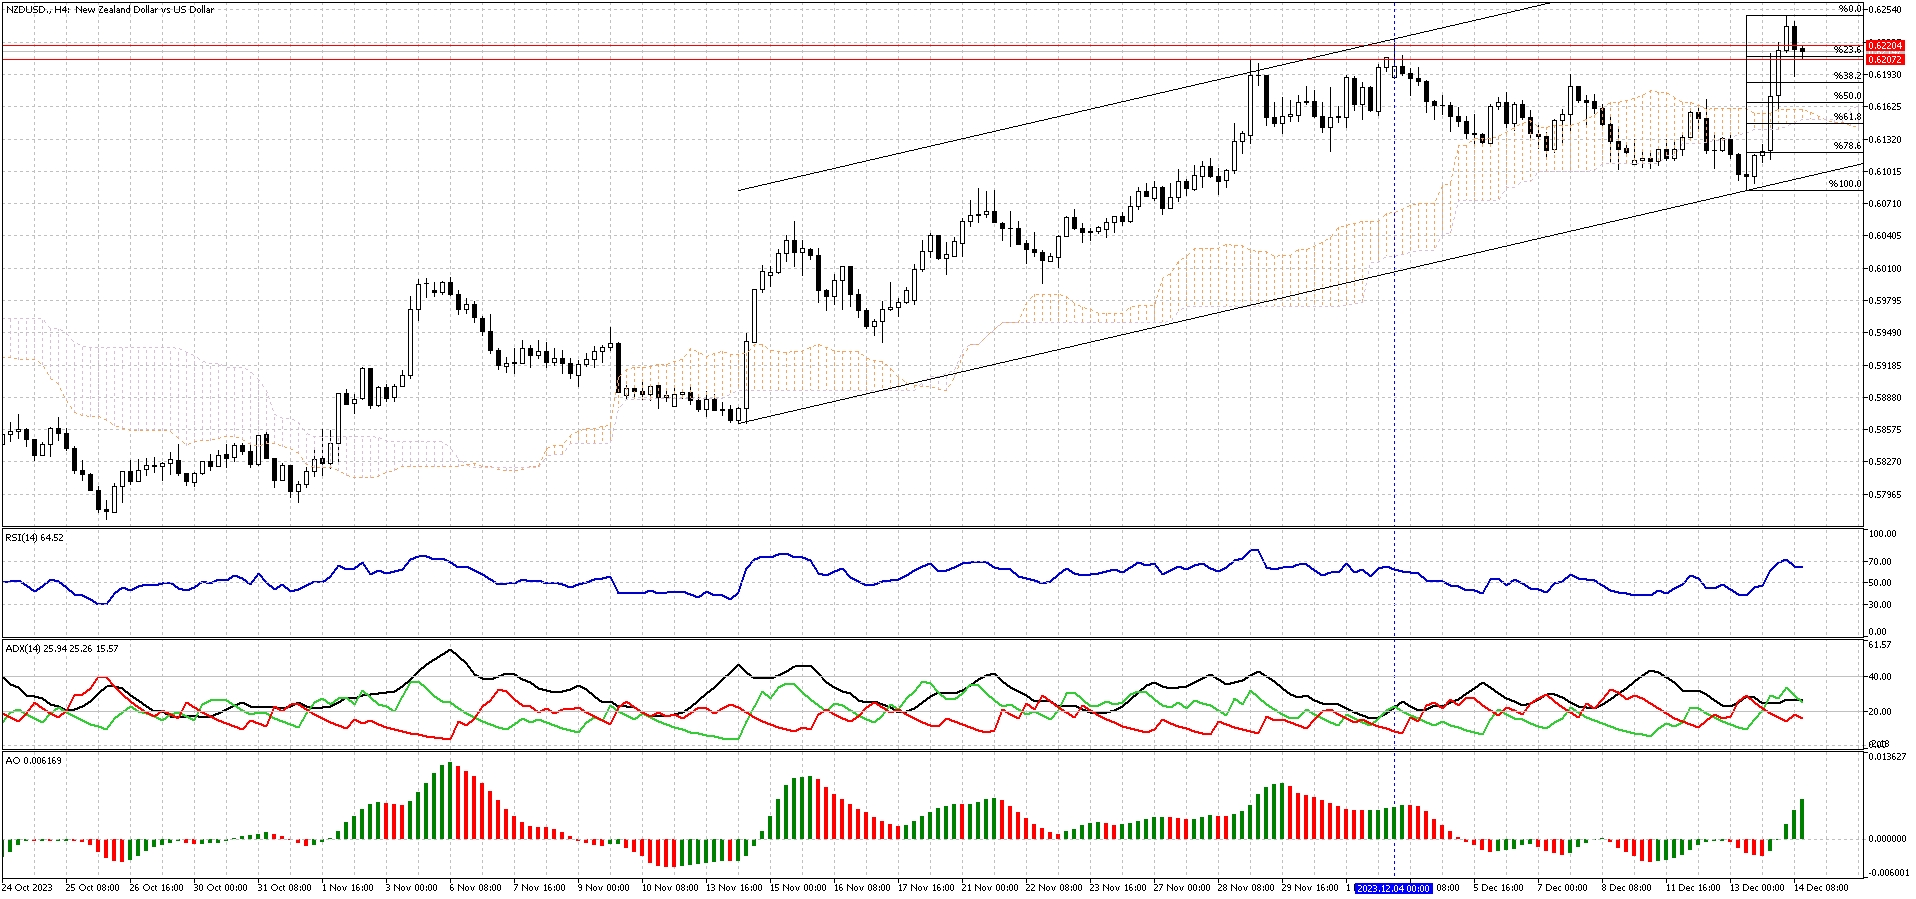
NZDUSD Technical Analysis – 4H Chart
US Fed’s Dovish Stance Boosts NZ Dollar
Bloomberg – The New Zealand dollar soared, surpassing $0.62 and hitting its highest point since July. This jump was influenced by a weakening US dollar, reacting to the Federal Reserve’s dovish stance. The Fed maintained interest rates but hinted at potential rate cuts next year, according to its “dot plot.”
Investors in New Zealand closely watch the Reserve Bank of New Zealand’s (RBNZ) monetary policy. Recent data suggests that inflation in the country might be slowing down more than anticipated in the fourth quarter. This development challenges the expectation of further interest rate hikes by the RBNZ. Specifically, New Zealand’s food prices, which comprise 19% of the consumer price index, dropped to 6% in November from 6.3% in October, marking the lowest level since January 2022. As a result, analysts are lowering their quarterly inflation predictions. Last month, the RBNZ held the cash rate at 5.5%, although they indicated that another increase might be needed if inflation remains high.