AUDUSD Analysis – 3-June-2024
The AUD/USD currency pair trades at $0.664, with immediate support at $0.663. Market analysis indicates that the pair is trading sideways with no significant momentum.
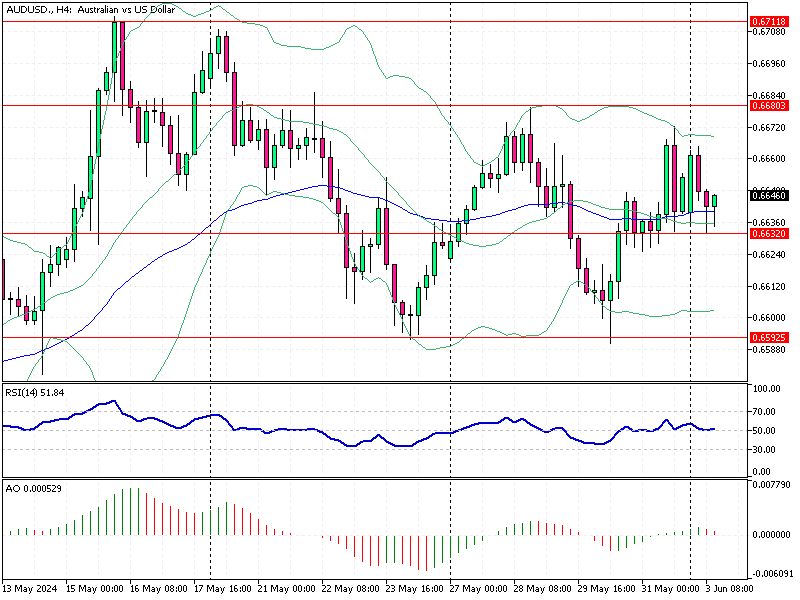
Mild Bullish Signals on 4-Hour Chart
AUDUSD Analysis – 3-June-2024
Technical indicators in the 4-hour chart provide a deeper insight.
- The Bollinger Bands are narrowing, and the price is above the median line, suggesting a mildly bullish market.
- However, the RSI indicator hovers around the 50 line, indicating a lack of momentum.
- The Awesome Oscillator bars are red and decreasing, signifying a weakening uptrend and a potential price drop.
AUDUSD Analysis – 3-June-2024
From a technical perspective, if AUD/USD bulls can maintain the price above the immediate support at $0.663, the pair may target the key resistance level at $0.668. Should buying pressure increase, the next bullish target would be $0.671.
Bearish Scenario
Conversely, if bears push and stabilize the price below the $0.663 support, the bearish momentum could drive the price down to the next support at $0.659.
Summary
It’s crucial for traders and investors to watch these levels. A break above $0.668 could signal a continuation of the bullish trend, while a drop below $0.663 could indicate a shift towards a bearish trend. Monitoring these key support and resistance levels can help make informed trading decisions.