Bitcoin Technical Analysis: Bulls Targeting 40K
In today’s BTCUSD technical analysis, we delve into the Bitcoin’s price action in the 4-hour chart.
Bitcoin has successfully surpassed the $38,250 mark in today’s trading session, indicating a strong upward trend. Currently, the key hurdle for Bitcoin’s continued growth is the median line of its bullish flag pattern. A closer look at the market’s technical indicators reveals that the Relative Strength Index (RSI) still has some capacity to enter into what is known as the overbought zone. Adding to this bullish sentiment, the awesome oscillator’s bars have shifted to green, highlighting the growing strength in upward movement.
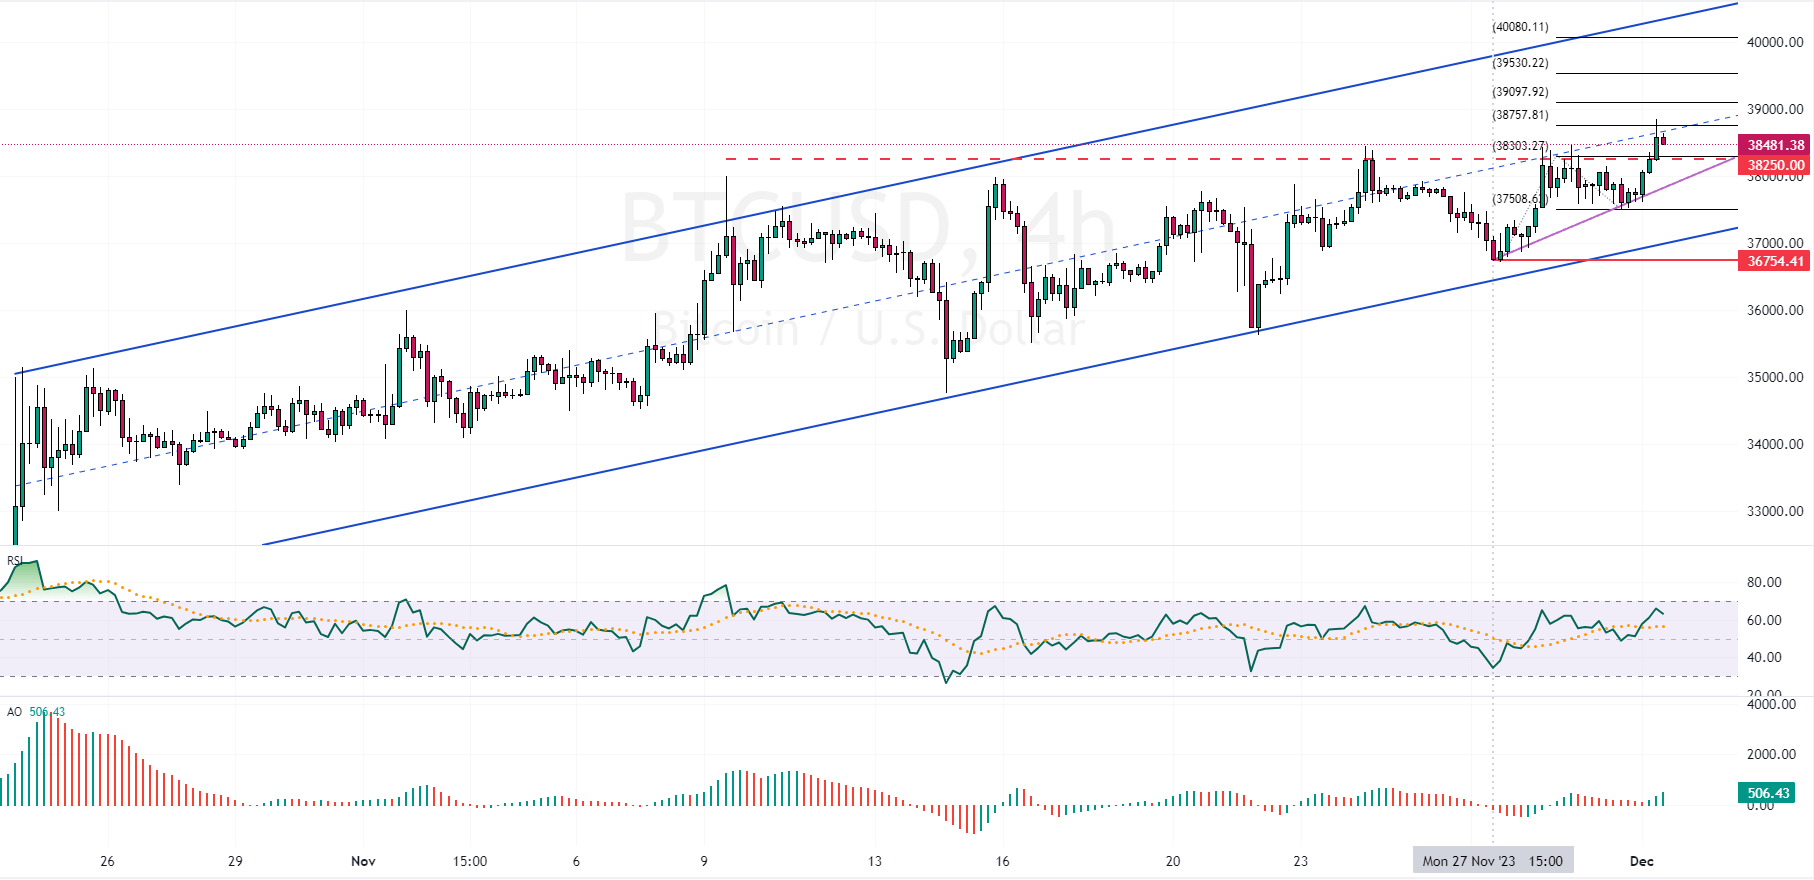
Bitcoin Technical Analysis – 4H Chart
Given these indicators, the median line of the bullish flag might struggle to contain this surge in buying interest. As a result, market experts from Solid ECN are predicting a further rise in the BTCUSD value, potentially reaching as high as $40,000, aligning with the flag’s upper boundary.
It’s important to note that the bullish scenario in this Bitcoin technical analysis is valid as long as the price ranges inside the bullish flag.