EURUSD Technical Analysis: Ichimoku on Trial
The EURUSD pair has been trading in a declining since the late of November, as the US dollar strengthened against the euro amid rising inflation expectations and hawkish signals from the Federal Reserve. The pair reached a low of 1.083, the lowest level since July 2020.
However, the pair has shown some signs of recovery in the past few days, as the euro gained some support from positive economic data and vaccine optimism in the eurozone. The pair bounced back from the 38.2% Fibonacci retracement level of the downtrend, which acted as a strong support, and climbed above the 23.6% level, which acted as a resistance.
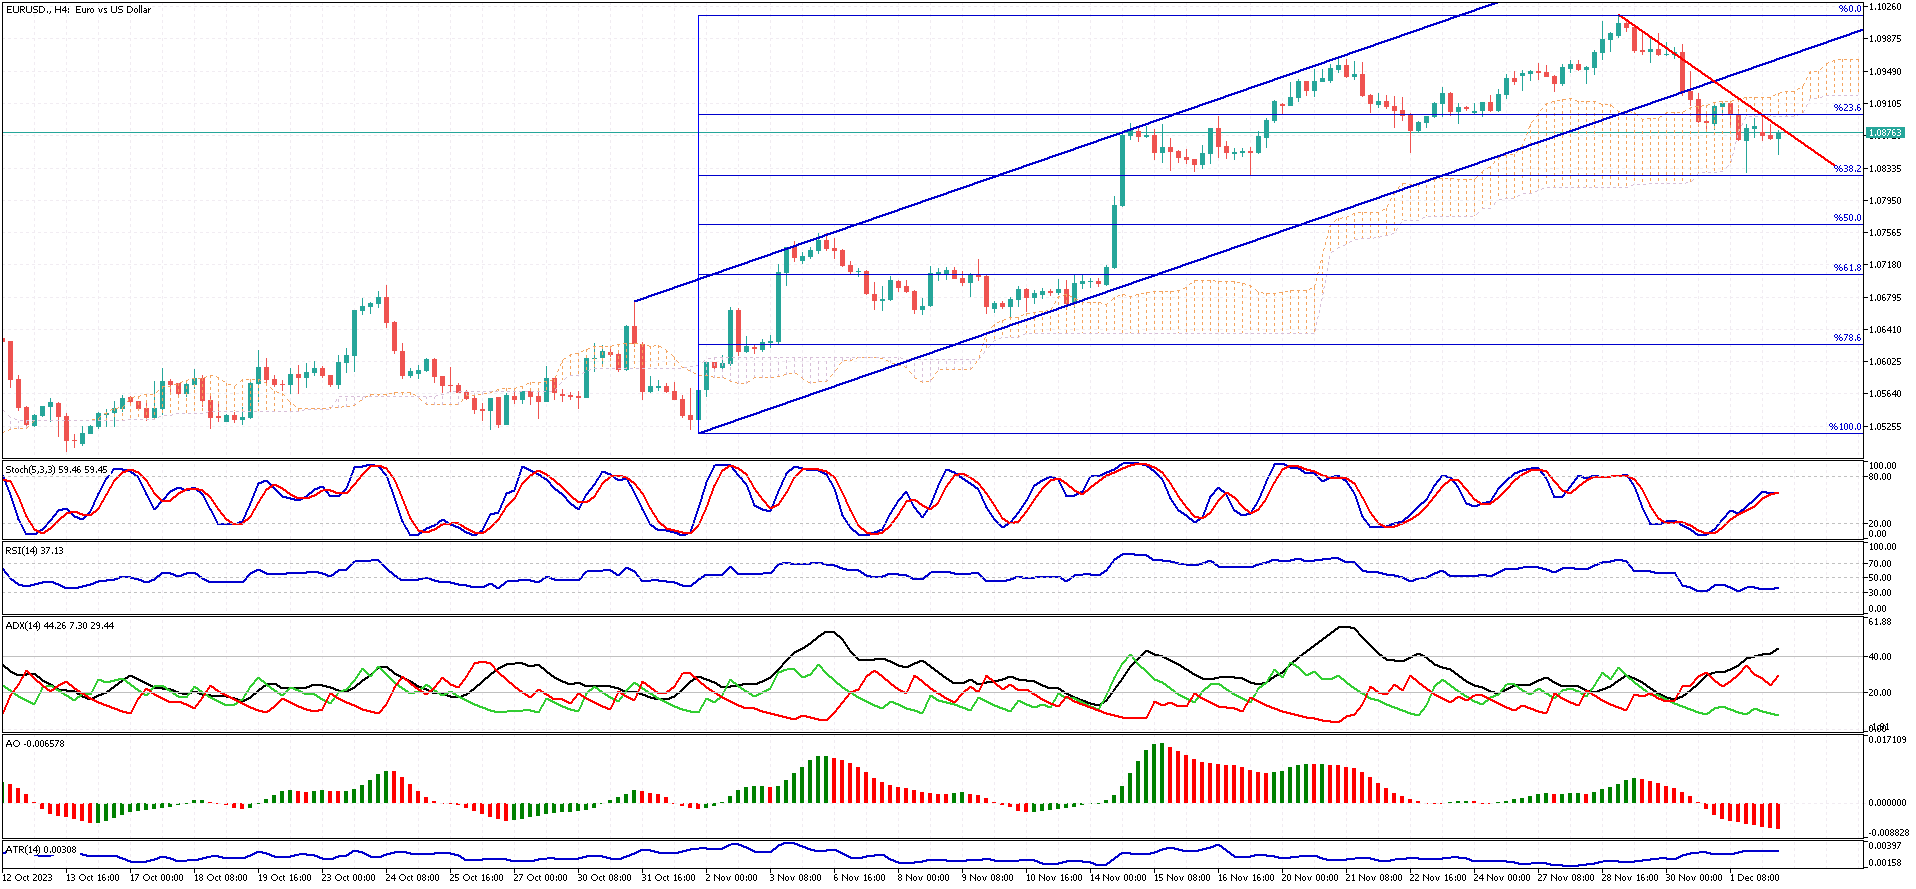
EURUSD Technical Analysis – 4H Chart
The pair is now facing a crucial test at the Ichimoku cloud, which is a dynamic indicator of trend and momentum. The cloud acts as a support or resistance zone, depending on the position of the price relative to it. If the price is above the cloud, the trend is bullish; if the price is below the cloud, the trend is bearish; and if the price is within the cloud, the trend is unclear or changing.
The technical indicators are suggesting that the pair is more likely to resume its downtrend than to break above the cloud. The RSI is below 50, indicating bearish momentum; the Awesome Oscillator is below zero, indicating bearish trend; and the ADX is above 40, indicating a strong trend. Therefore, traders should look for sell signals while the pair hovers below the cloud.
However, if the pair manages to break above the cloud and close above it, the bearish scenario of this EURUSD technical analysis would be invalidated. This would indicate a possible trend reversal and a shift in market sentiment.