Gold Analysis – December-25-2023
Gold is approaching the 38.2% Fibonacci support level, decisively bypassing the 23.6% Fibonacci retracement level. This movement is a clear sign of a strong bearish trend in the short term.
Examining the 4-hour gold chart provides more insight into this trend. Here, we see the price nearing the lower boundary of the bullish flag pattern, which coincides with the Ichimoku cloud. This convergence adds significant weight to the potential strength of this support zone.
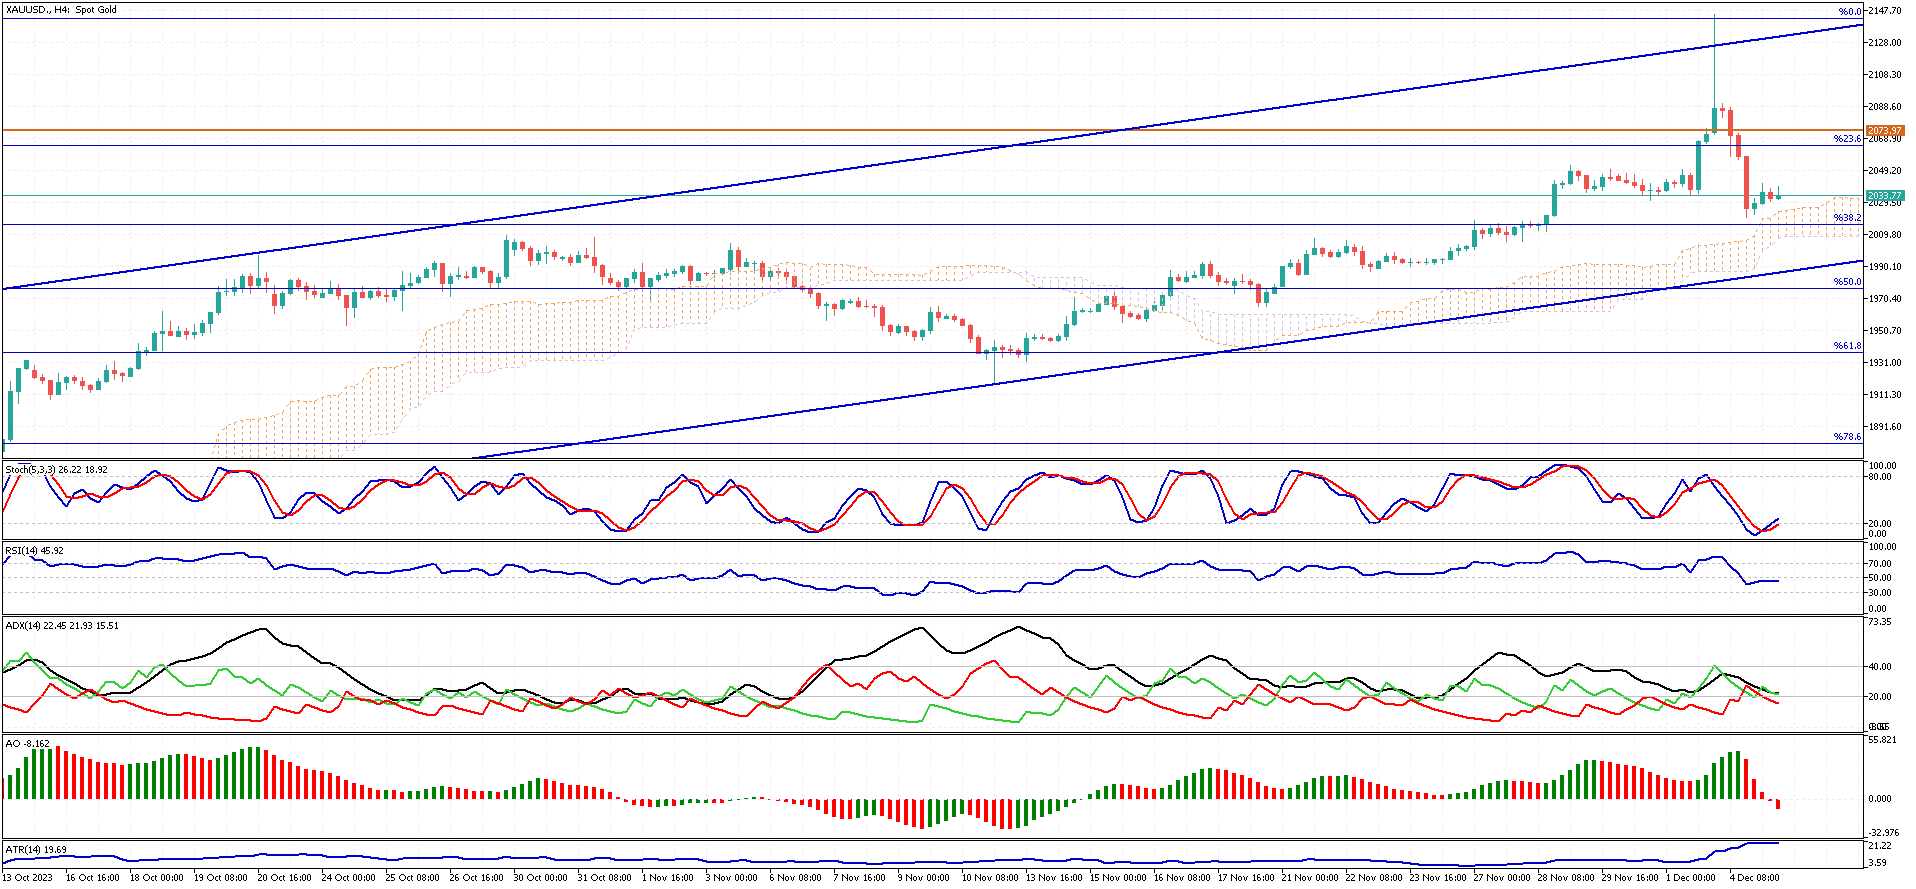
XAUUSD Price Analysis – 4H Chart
Considering the recent upward trend in gold and the prevailing bullish trajectory, there’s a strong possibility that the price might rebound from this support area and aim for the $2,067 resistance level. Yet, a break below the bullish flag pattern and the cloud would suggest a reversal of this bullish trend, potentially paving the way for further declines.