USDJPY Analysis – December-4-2023
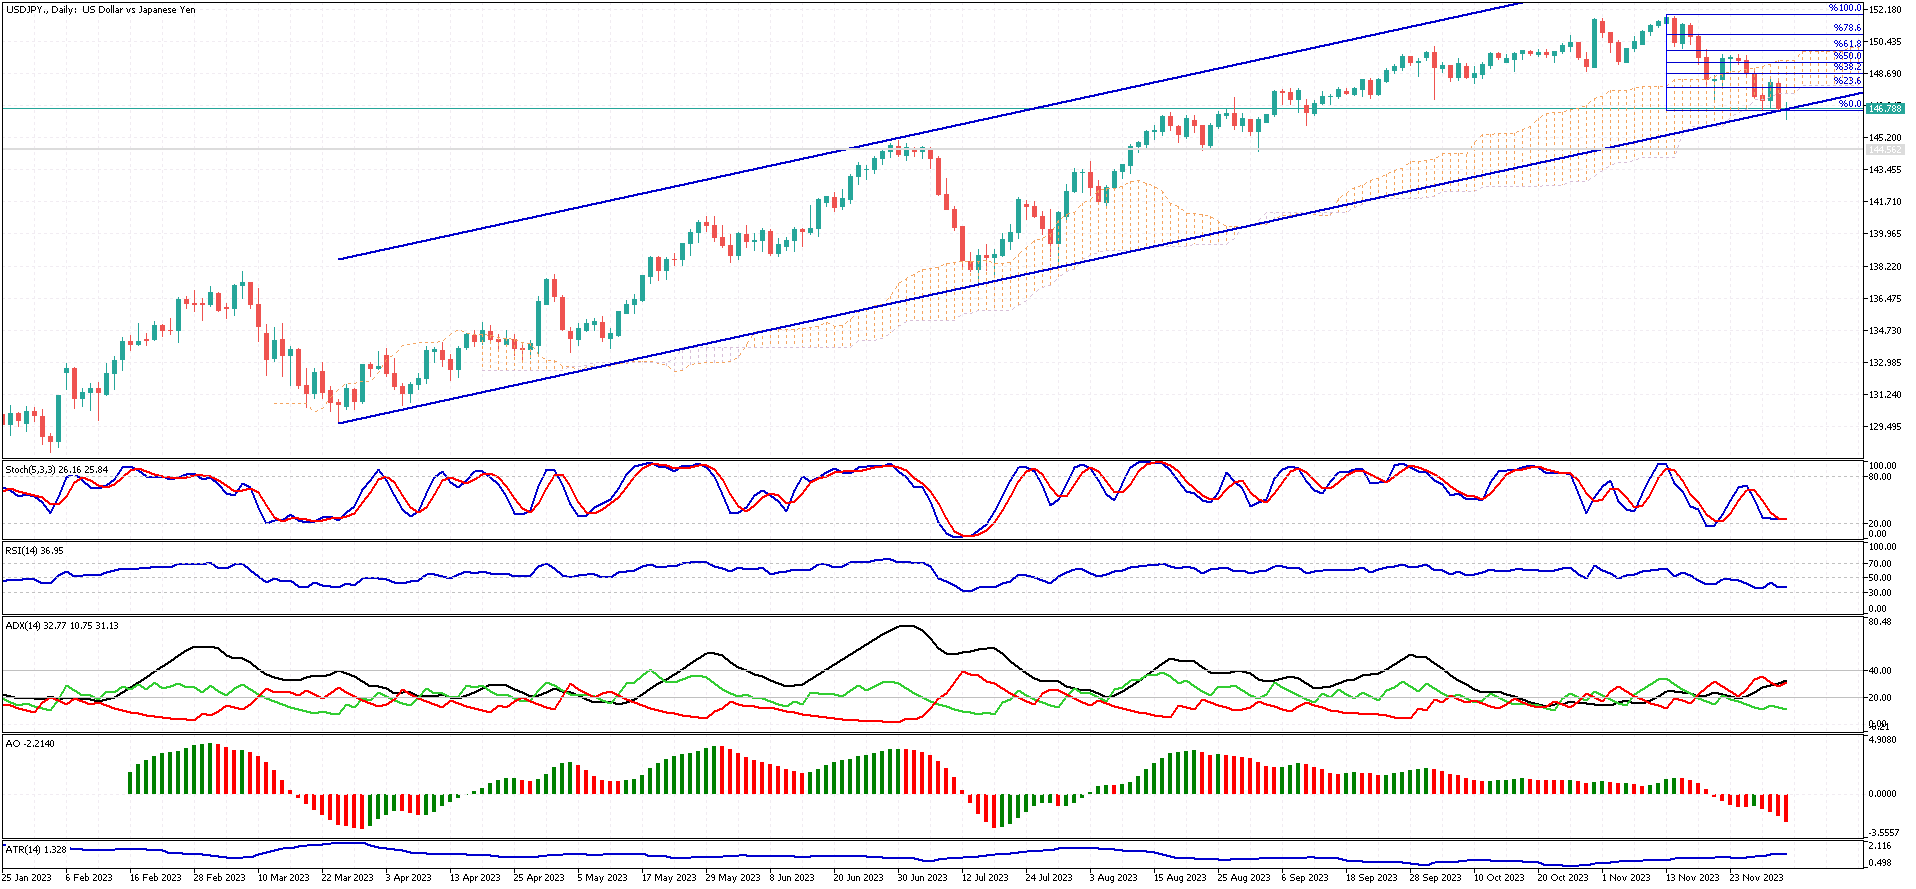
USDJPY Technical Analysis – The USDJPY currency pair trades within a bullish flag pattern, signaling potential upward movement. However, a significant development has been observed as the price recently dipped below the Ichimoku cloud, suggesting a possible shift in the trend’s direction.
USDJPY Technical Analysis – Daily Chart
At this moment, the pair is testing the lower boundary of the bullish flag, and the presence of the ADX indicator highlights the likelihood of increased market volatility. Should the pair breach this critical level, we might witness a downward movement extending towards the 144.5 support mark. This would represent a notable shift from the current pattern and could lead to significant market adjustments.
Conversely, the current upward trend may persist if the bulls uphold the price above the 146.2 threshold. In such a scenario, the pair could aim for the 23.6% level on the Fibonacci retracement scale, followed by a possible ascent to the 38.2% mark. This progression would underscore the strength of the bullish trend and could offer exciting opportunities for traders to monitor these developments closely.