USDCAD Analysis – December-13-2023
On November 12, the USDCAD currency pair rose above the Ichimoku cloud, signifying a potential shift in market dynamics. It seems to be using the cloud as a foundation for support, aligning with the previously overcome bearish channel. While technical indicators hint at a possible downward trend, there’s still a chance for the price to climb, especially if the USDCAD remains above its bullish trendline. Should this upward trajectory continue, the midpoint of the Fibonacci retracement tool might be the next goal for bulls.
However, if the USDCAD settles below the cloud and maintains that position, it would undermine the bullish forecast. In such a bearish turn, the first target might be the low point reached in November, specifically at 1.34781.
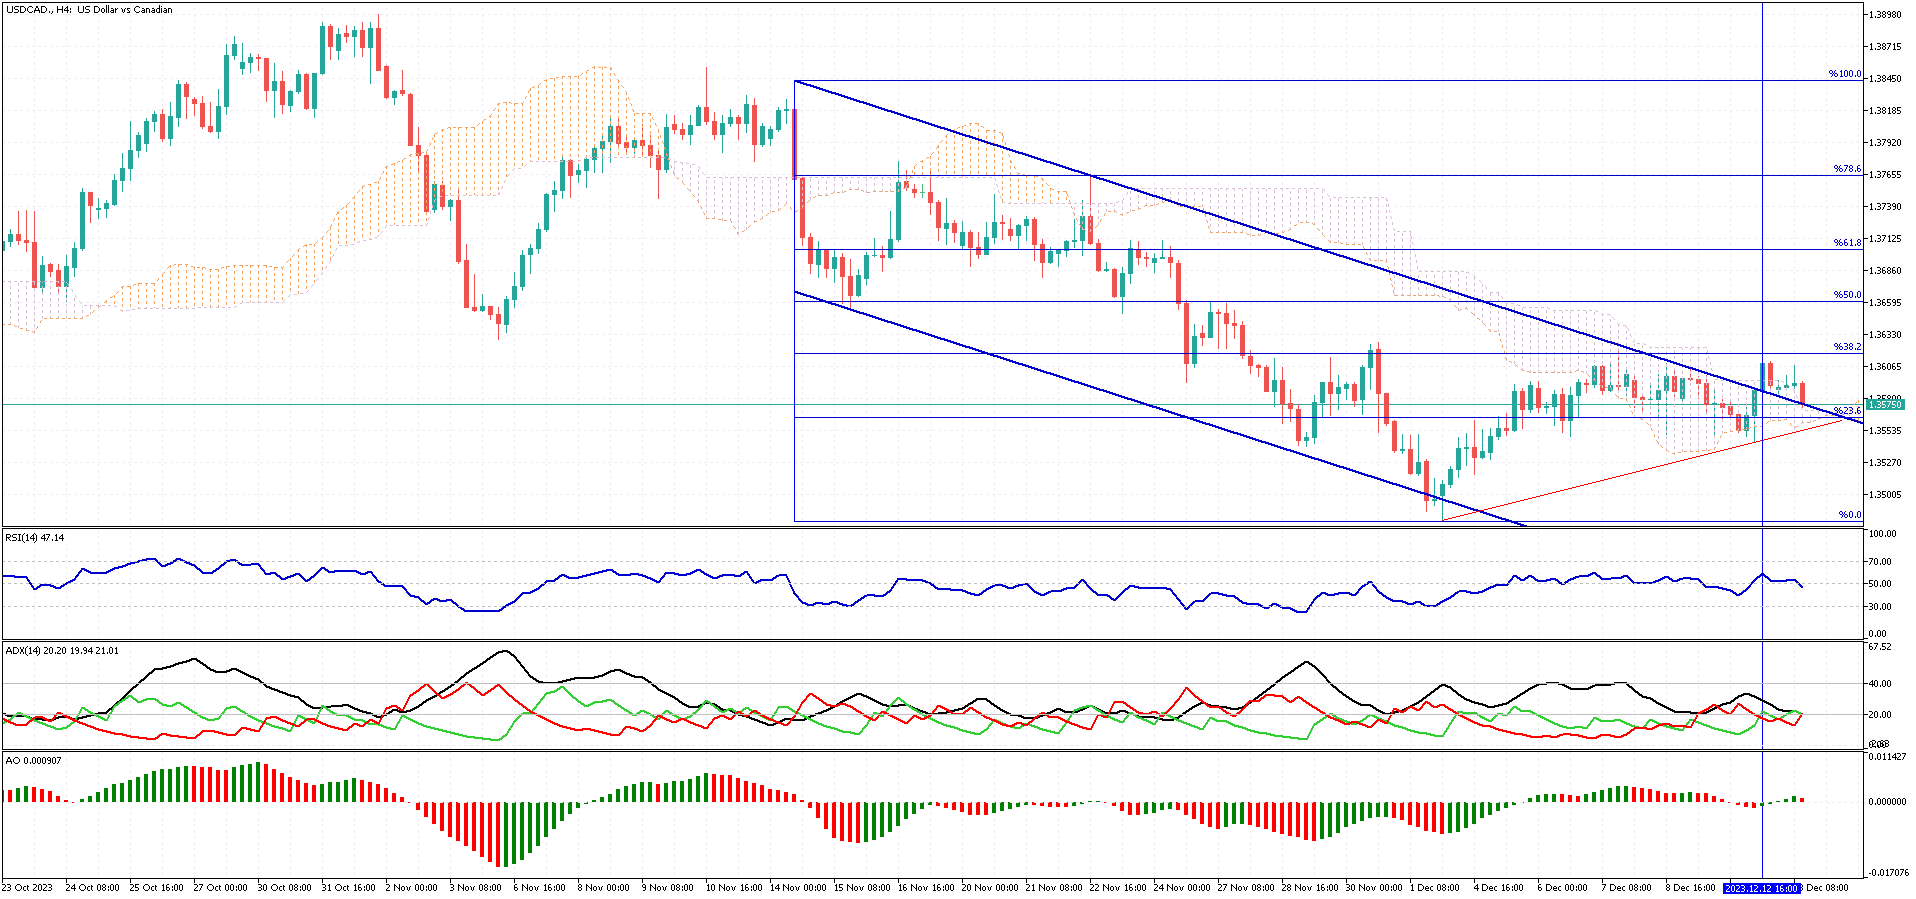
USDCAD Technical Analysis – 4H Chart
TSX Dips Amid Oil Prices and Inflation Shifts
Bloomberg – On Tuesday, the S&P/TSX Composite Index dropped 0.4%, settling at 20,233, marking its lowest level in almost two weeks. This decline was primarily driven by a significant drop in energy stocks, influenced by a more than 3% decrease in oil prices. Additionally, the latest USTheevealed an unexpected 0.1% increase, defying the predicted 0% rise. This development dampened hopes for interest rate cuts by the Federal Reserve in March.
Energy stocks, in particular, felt the impact of the dip in oil prices. This was attributed to worries about a potential oversupply in 2024. Notable energy companies like Cenovus, Canadian Natural, and Suncor saw their shares fall by 2.5%, 1.5%, and 2.1%, respectively. Mining stocks also experienced losses. The outlook for gold put pressure on major Canadian gold miners. Companies such as Franco-Nevada, Barrick Gold, Agnico, and Wheaton Precious Metals recorded declines ranging from 1.6% to 3.2%.