MATICUSD Analysis: Prices at a Crossroads
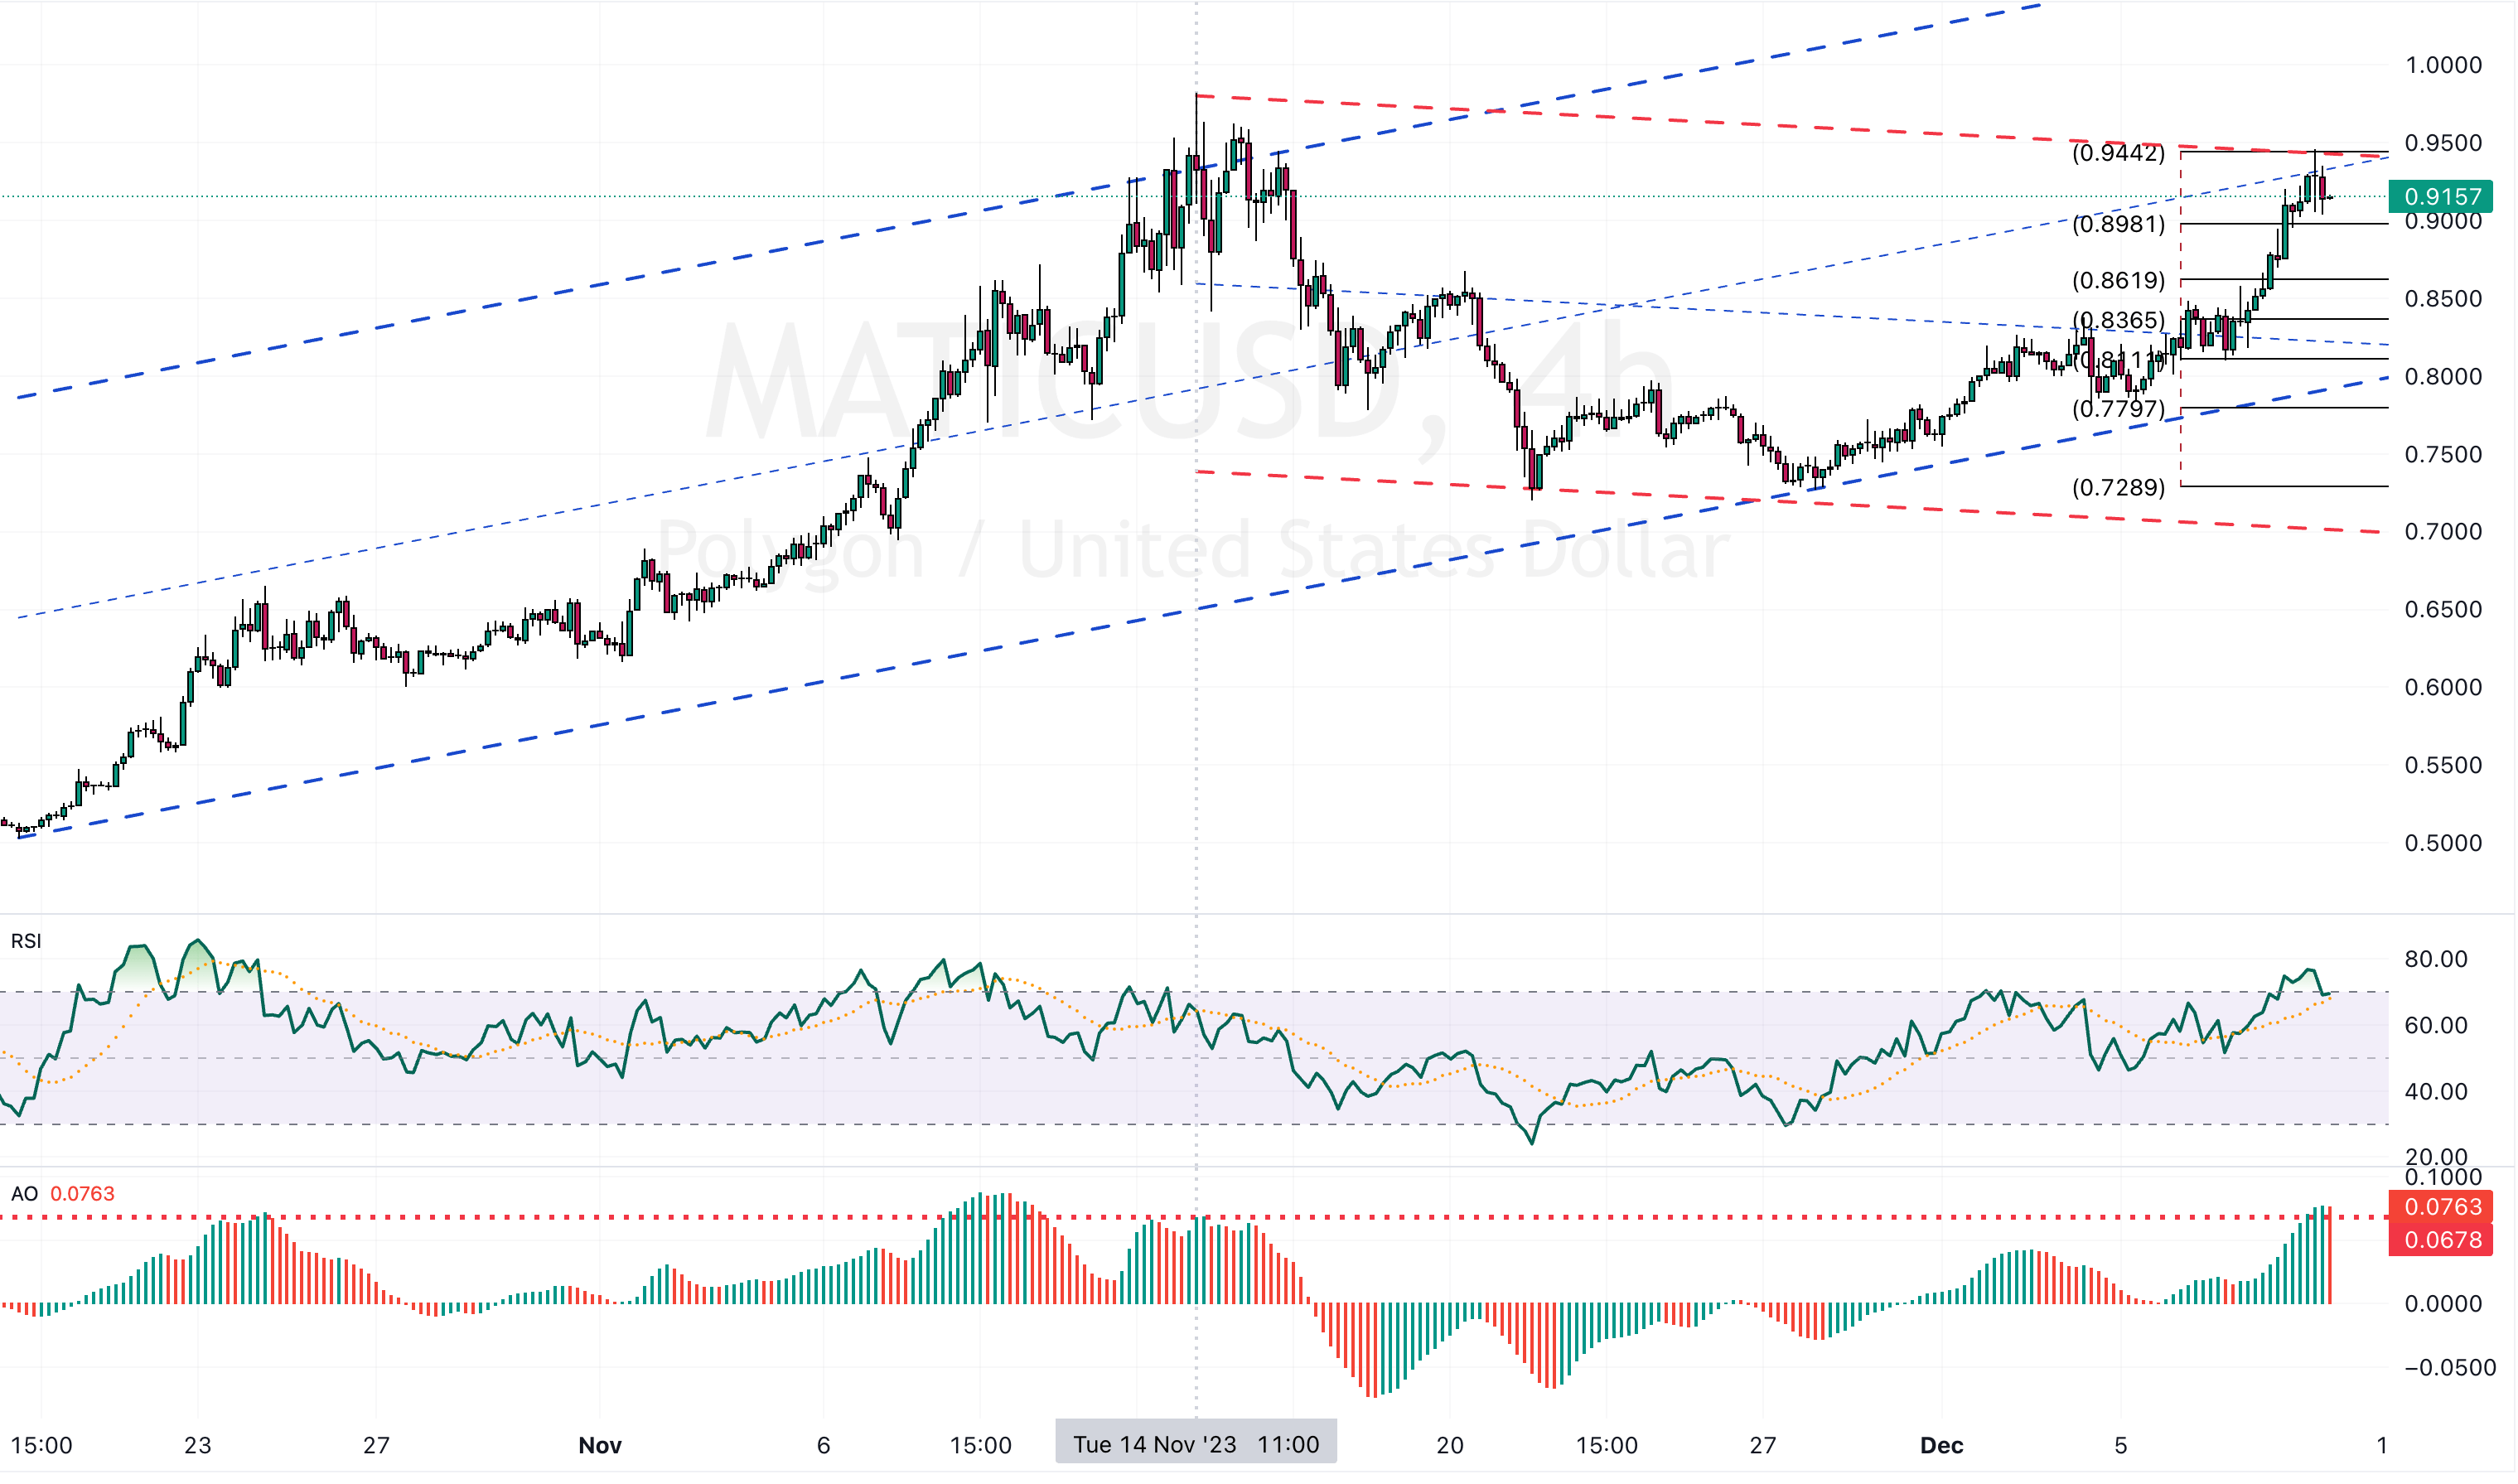
MATICUSD analysis – The pair has recently experienced a notable surge, reaching as high as $0.942. This price level is significant as it aligns with the median line of the bullish flag pattern, depicted in blue on the chart.
On the 4-hour chart, a Doji candlestick pattern has emerged, suggesting a potential trend reversal or the beginning of a consolidation phase. This is further supported by the Relative Strength Index (RSI), which is now moving below the overbought area, hinting at a possible slowdown in the upward momentum.
MATICUSD Analysis – 4H Chart
For the bearish scenario to unfold, it’s crucial that the bears manage to close the price below the 23% Fibonacci retracement level, at approximately $0.8981. If this occurs, we could see increased downward pressure on the MATICUSD price, potentially leading it to drop towards the $0.8619 mark, followed by a test of the $0.8365 support level.
Conversely, if the bulls manage to push the price above the median line (a likely scenario if the price remains above the 23% Fibonacci level) the pathway towards the November 2023 high will be paved. This bullish perspective would indicate a robust continuation of the upward trend.
In summary, the MATICUSD pair is at a critical juncture, with its future direction hinging on these key Fibonacci levels. Both traders and investors should closely monitor these levels for indications of the pair’s next significant move.