EURUSD Technical Analysis – January-10-2024
The EURUSD pair has failed to break the 38.2% Fibonacci support, leading the instrument to range inside the bearish flag. The price is 1.093 at the time of writing, which aligns with the 50% Fibonacci support.
The technical indicators don’t show any significant changes. The RSI indicator hovers below the 50 level and the bars of the Awesome Oscillator are tiny and close to the signal line. Meanwhile, the ADX indicator line is flat and above the 20 level, suggesting a trend may emerge soon.
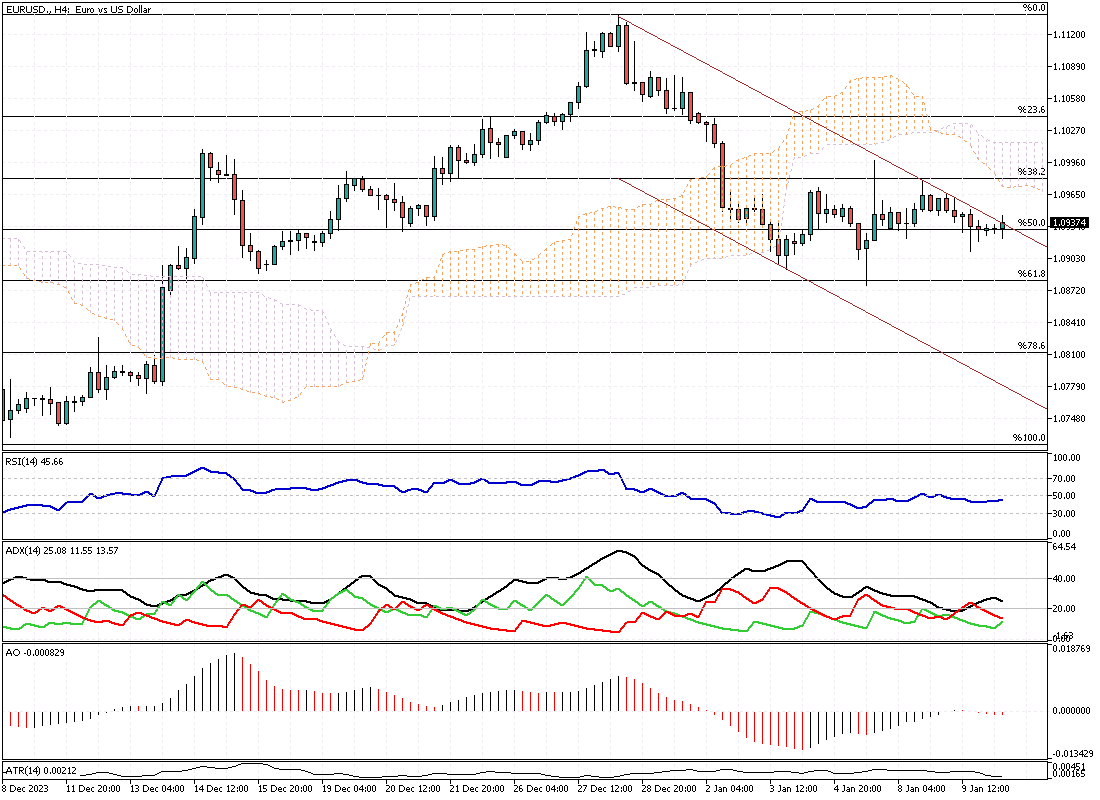
EURUSD Technical Analysis – 4-Hour Chart
We expect the price to decline if the bears maintain the price inside the channel. In this scenario, the 61.8% Fibonacci level could be the initial target for sellers.
Conversely, if the bulls break out from the channel, the market would likely test the Ichimoku cloud as resistance.