AUDUSD Analysis – November-27-2023
Our latest AUDUSD technical analysis closely examines the pair’s movement on the daily chart. Today’s trading session shows a notable increase in the AUDUSD price. During this Technical Analysis, the AUD bulls have surged above the 50% Fibonacci retracement. This significant level coincides with the upper boundary of the bullish flag pattern observed in the daily chart.
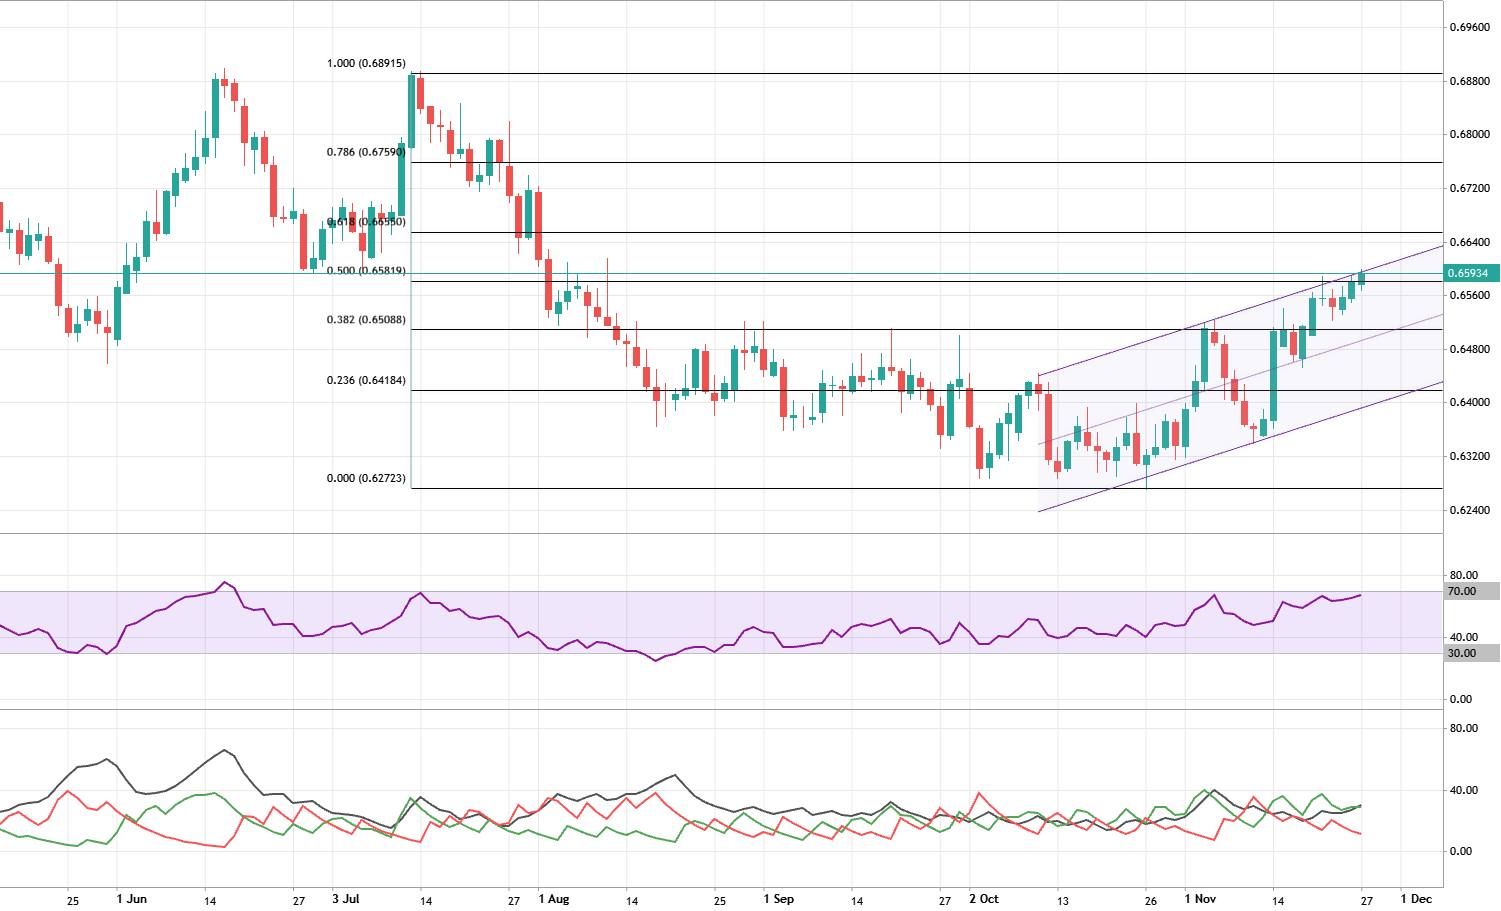
AUDUSD Technical Analysis – Daily Chart
As the Relative Strength Index (RSI) approaches the overbought territory, there’s a possibility that the AUDUSD pair may enter a ranging phase above the %65.8 resistance mark. Given the current saturation of the AUDUSD price due to buying pressures, it’s advisable not to pursue long positions at this level.
Retail customers should consider a more cautious approach. A strategic move would be to wait for the pair to revisit the midpoint of the bullish flag. This specific level, aligning with the %38.2 Fibonacci level, could offer a decent opportunity for buyers to enter the market.