EURUSD Technical Analysis: Declined Eased
by InkWell November 30, 2023 · Forex Market Analysis
In today’s EURUSD technical analysis, we have analyzed the EURUSD in the 4-hour chart. But let’s learn about the recent important events in the U.S to have a comprehensive insight of both technical and fundamental aspects of the currency pair.
Dollar’s November Performance
Bloomberg – In the closing days of November, the dollar index saw a slight rise to 103.2, primarily due to a weakening Euro, which fell short of inflation predictions. Despite this uptick, the dollar is poised to conclude November with about a 3% decrease, marking its most significant monthly drop in a year. This decline keeps the dollar near its lowest point since mid-August. The prevalent expectation is that the Federal Reserve’s period of monetary tightening might be winding down, with potential interest rate cuts on the horizon for the next year.
Furthermore, the latest economic data presents a varied picture of the U.S. economy. Annual headline and core PCE inflation rates aligned with forecasts, yet the headline index remained unchanged from September, defying expectations of a 0.2% increase. Consumer spending moderated as anticipated, while initial jobless claims showed a smaller increase than predicted. This blend of economic indicators continues to offer a complex outlook for the U.S. economy.
EURUSD Technical Analysis
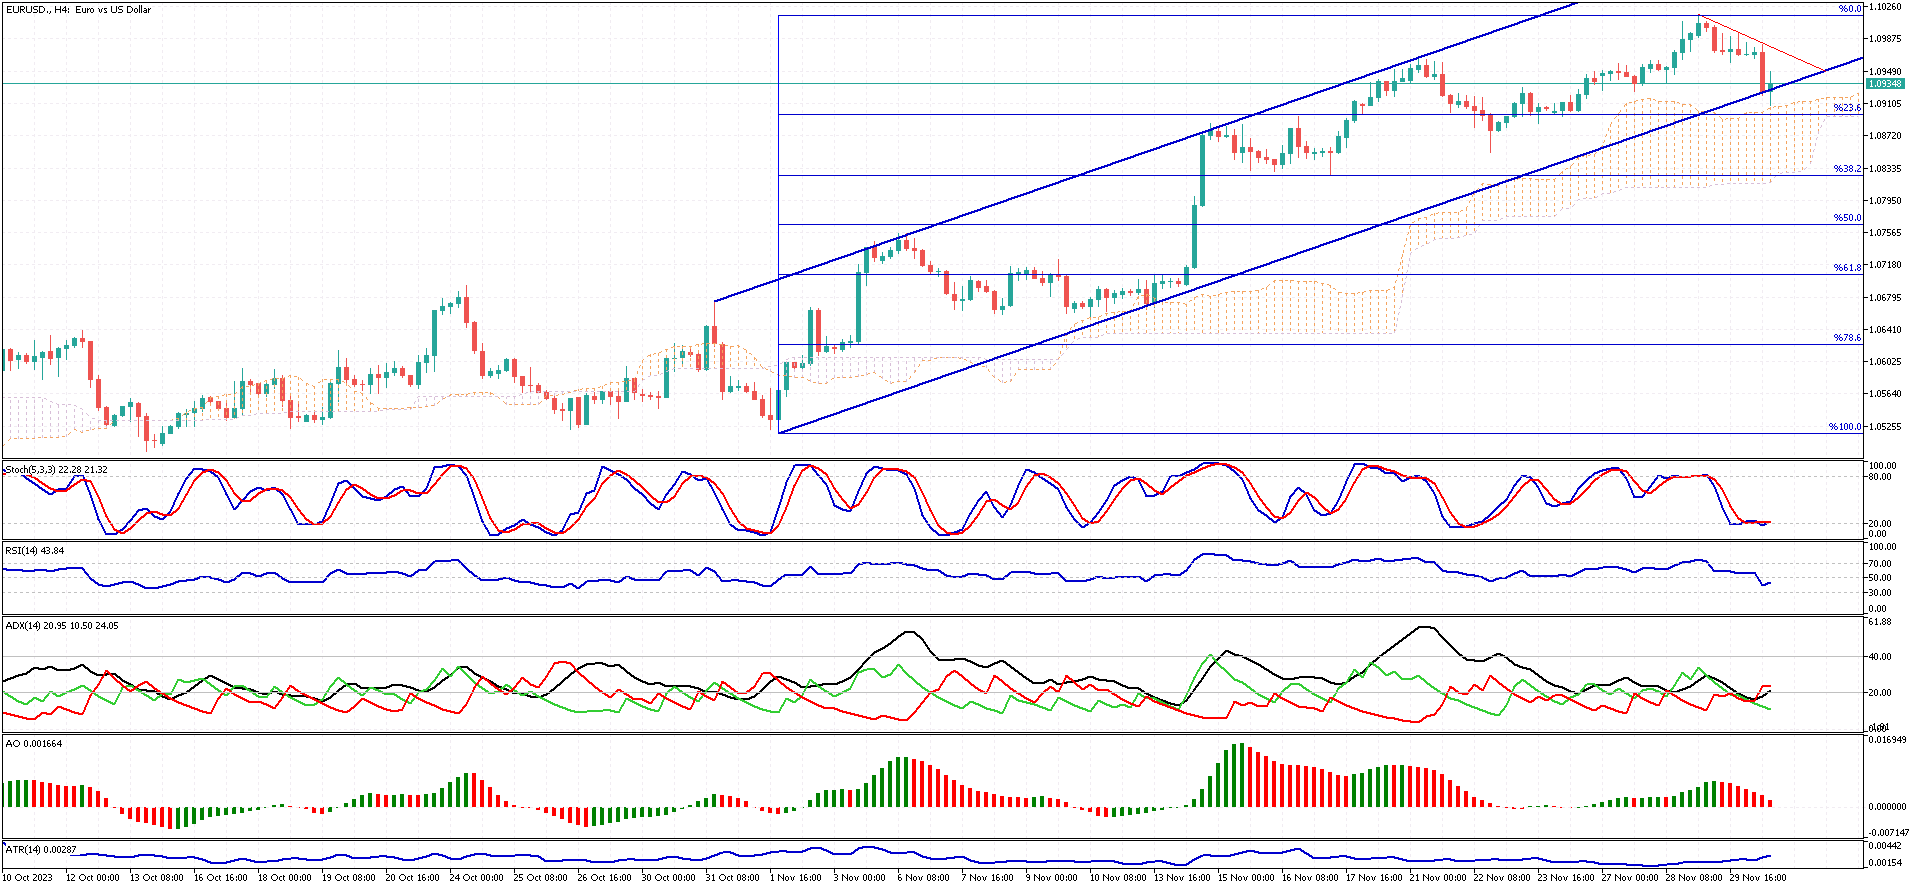
The EURUSD currency pair’s downtick has slowed near the lower line of the bullish flag. This crucial point is additionally supported by the Ichimoku cloud. To maintain the bullish trend, the price should remain above the cloud and/or the 23.6% Fibonacci level. If these conditions are met, we can expect the EURUSD to continue its upward trend within the flag.
For those considering a long trade on the pair, it’s advised to wait for technical indicators to align with the bullish scenario. The Stochastic oscillator is currently in the oversold zone, and the ADX indicator is nearing the 20 level. While the ADX suggests the trend is losing momentum, a bullish signal would be the Stochastic oscillator or RSI crossing above their respective signal lines.
On the other hand, the bullish flag pattern would become invalid if the price falls and stabilizes below the 23.6% Fibonacci level. However, it’s important to note that this event would not negate the bullish trend as long as the EURUSD stays above the Ichimoku cloud.
Tags: EURUSD


