GBPUSD Analysis – November-29-2023
In today’s GBPUSD analysis, we delve into the 4-hour chart and recent updates on U.S. Treasury yields.
U.S. Yields Dip Amid Fed Rate Speculations
Yields on the U.S. Treasury notes saw a further reduction, with the 10-year note dropping around seven basis points to 4.26% on Wednesday, a low not seen since September 13. Similarly, the yield on the 2-year note decreased by six basis points to 4.68%. These declines follow remarks from Federal Reserve officials suggesting a potential rate cut next year.
Fed Board Member Waller expressed growing confidence in the current policy’s ability to slow the economy and return inflation to the 2% target. Governor Bowman also indicated the likelihood of additional policy adjustments to achieve the Fed’s inflation goals. However, her recent stance on higher rates seems more conditional than before. As investors look forward to critical economic data releases this week, including the PCE Index and ISM Manufacturing PMI, the benchmark yield for November has experienced a 60-basis point fall.
GBPUSD Analysis – November-29-2023
GBPUSD has embarked on a stronger upward trend, surpassing the previous bullish flag. The pair trades around 1.2703 when writing, while the RSI indicator has remained in the overbought zone for nearly 24 hours. Our last GBPUSD technical analysis highlighted that the pair was overbought, advising retail traders against going long. This assessment remains valid.
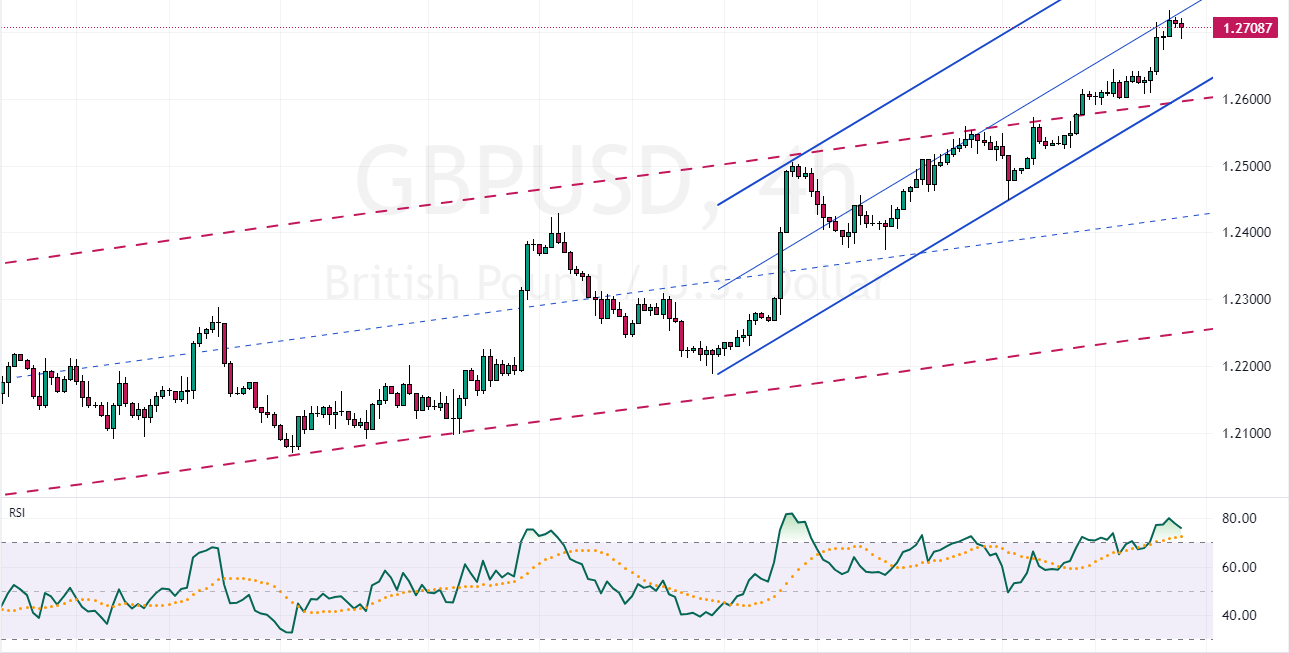
GBPUSD Technical Analysis – 4H Chart
The 1.260 support level presents a decent and reasonable opportunity to go long on the GBPUSD pair, should the price undergo some corrections.