EURUSD Technical Analysis: Bullish Trend on the Horizon
EURUSD Technical Analysis – In mid-December, the EURUSD pair reached a notable peak, climbing as high as 1.1016. This level, which was the high for November, encountered resistance. Interestingly, the Awesome Oscillator indicator provided additional insight, showing a divergence that hinted at a potential change in trend. As a consequence, the EURUSD price dipped below the 38.2% Fibonacci support level. Notably, this support area was further reinforced by the remnants of a previously broken bullish flag pattern.
Examining the technical indicators, we see signs suggesting the continuation of the bullish trend. For instance, the ADX indicator’s green bar rose above the crucial 20 level, indicating strengthening momentum. Similarly, the RSI indicator remains buoyant, hovering above the 50 mark, which typically signals a bullish sentiment. However, it’s important to note that the Awesome Oscillator is the outlier, presenting a bearish signal amidst otherwise bullish indicators.
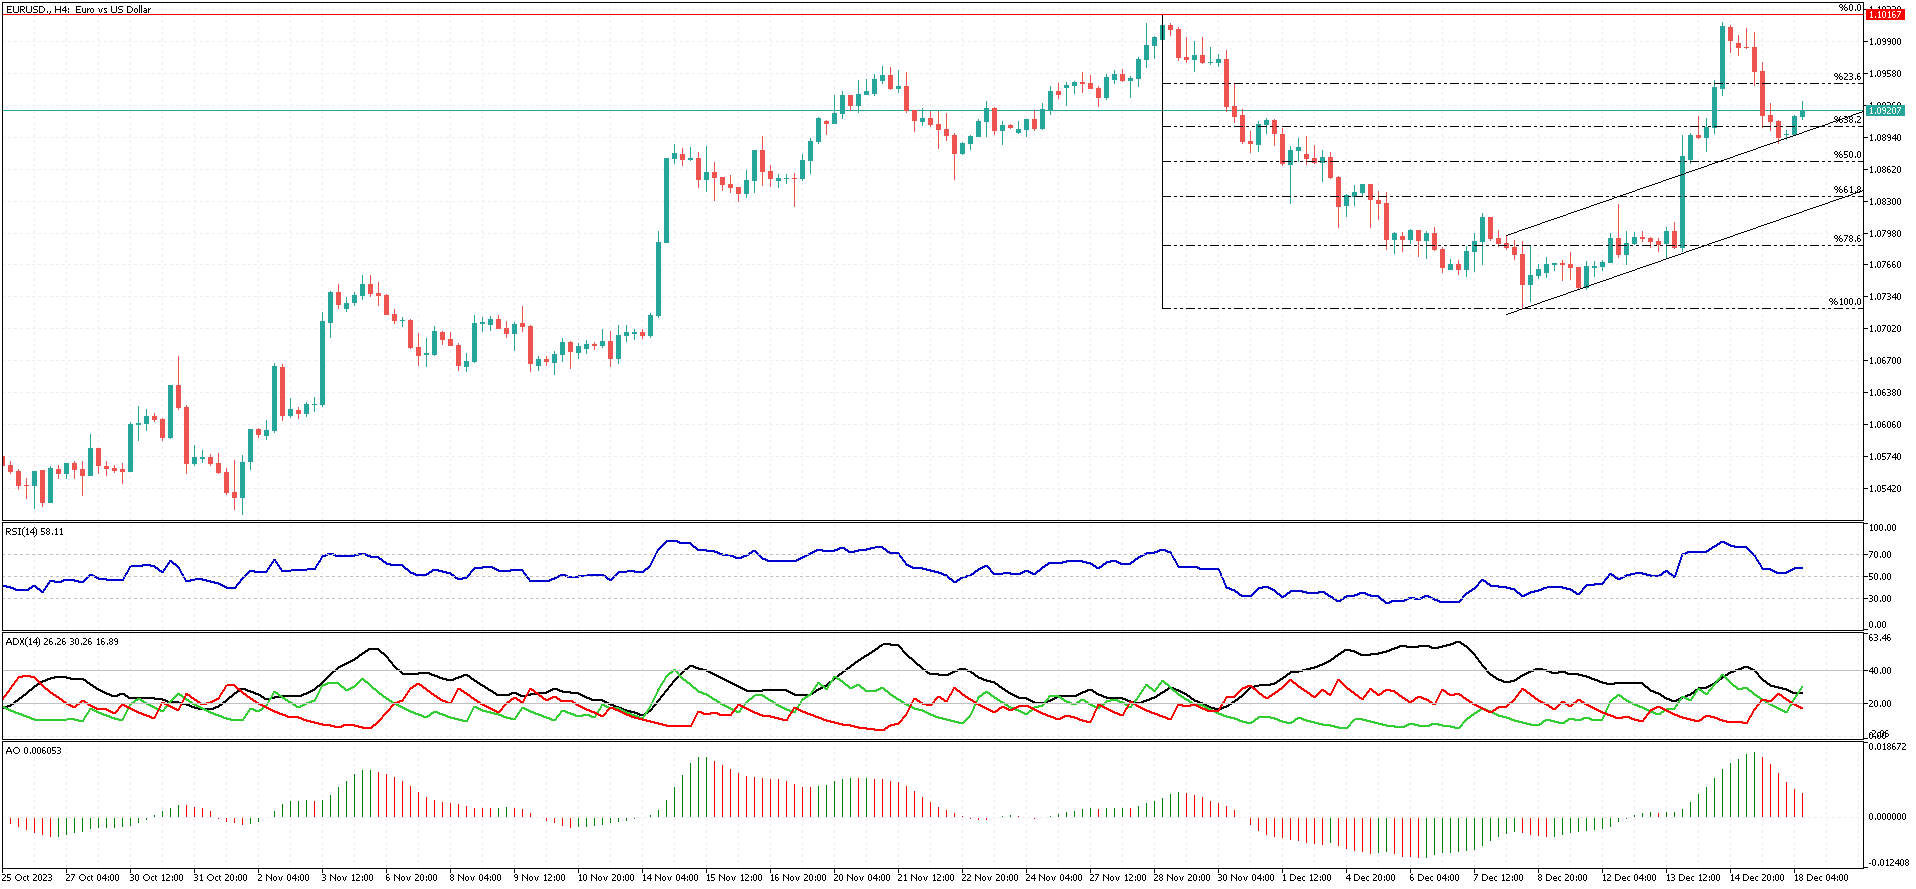
EURUSD Technical Analysis – 4H Chart
Should the bulls successfully maintain the price above the 38.2% Fibonacci level, we could witness the EURUSD price embarking on a new bullish wave. In this scenario, traders would likely set their sights on reaching or surpassing the recent high. This optimistic outlook hinges on the price’s ability to hold above this key support level.
Conversely, if the price settles below the 38.2% level, we may enter a consolidation phase. In such a case, the next levels of interest would be the 61.8% and 78.6% Fibonacci supports. The price behavior around these levels could provide further clues about the future trajectory of the EURUSD pair.