EURUSD Analysis – February-15-2024
On Thursday, February 15, the EUR/USD pair saw a modest increase, increasing by 0.0004 or 0.04%, closing the day at 1.0729 compared to 1.0725 at the end of the previous session. This subtle movement is part of the forex market’s more significant ebb and flow characteristic, where exchange rates constantly adjust in response to various global economic indicators, investor sentiment, and geopolitical events.
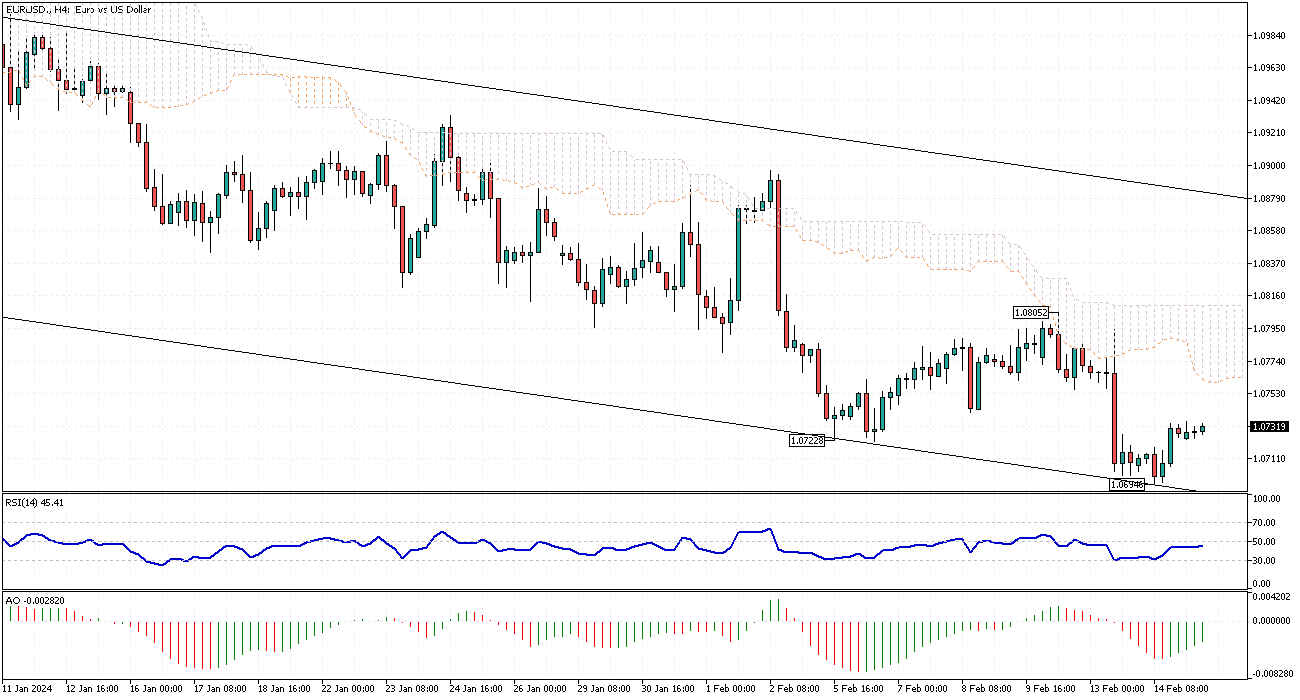
EURUSD Analysis 4-Hour Chart
Historical Peaks of the EURUSD
Delving into the historical performance of the EUR/USD exchange rate, it reached an unprecedented peak of 1.87 in July 1973. It’s important to note that the euro was officially introduced as a currency on January 1, 1999. The remarkable high of 1973 reflects a synthetic analysis based on a weighted average of the currencies that preceded the euro. This method of historical back-casting offers valuable insights into the long-term performance and volatility of the EUR/USD pair, helping investors and analysts understand potential future trends.
Understanding Synthetic Historical Prices
Before the introduction of the euro in 1999, the European currency landscape was diverse, consisting of the individual currencies of the member states. By analyzing synthetic historical prices, which project the euro’s value back in time using a weighted average of these previous currencies, we gain a broader perspective on the euro’s performance over decades.
This analysis enriches our understanding of the EUR/USD exchange rate dynamics. It provides a unique lens to view the euro’s strength and resilience in economic changes and challenges. This deeper historical context enhances our appreciation of the euro’s current position in the global economy and its interaction with the US dollar.