NZDUSD – Bullish Impetus Amid Overbought Condition
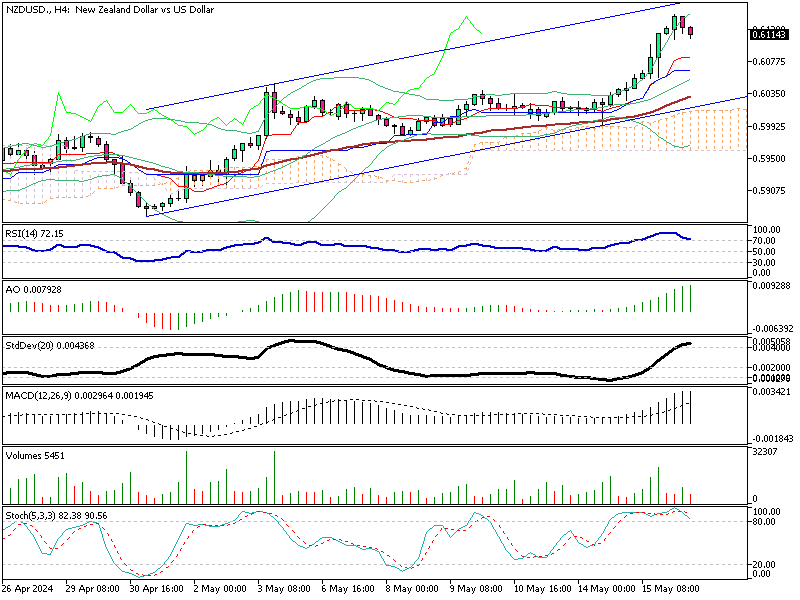
The NZD/USD 4-hour chart displays the New Zealand Dollar (NZD) trading against the US Dollar (USD). It includes multiple technical indicators, providing a detailed view of current market conditions and potential future movements.
At the time of writing, the pair trades at about 0.611.
NZDUSD – Bullish Impetus Amid Overbought Condition
Trendlines:
- The chart features an ascending channel, indicating a recent bullish trend. The price currently trades within this channel, suggesting a continuation of the upward movement.
Moving Averages:
- The price is trading above the 50-period Simple Moving Average (SMA), which indicates bullish sentiment in the short term.
Indicators
Bollinger Bands:
- The price is near the upper Bollinger Band, suggesting that the currency pair might be entering an overbought condition. The bands have expanded, indicating increased volatility.
Ichimoku Cloud:
- The price is above the Ichimoku Cloud, which is a bullish signal. The conversion line (Tenkan-sen) is above the baseline (Kijun-sen), indicating bullish momentum. The cloud ahead is also bullish, suggesting potential support.
RSI (14):
- The RSI is at 71.19, indicating overbought conditions. An RSI above 70 typically suggests a potential for a pullback or consolidation.
Awesome Oscillator (AO):
- The AO shows positive bars above the zero line, confirming bullish momentum. The increasing green bars suggest growing positive momentum.
Standard Deviation (StdDev 20):
- The standard deviation indicates high volatility. Recent increases in volatility suggest a potential for significant price movements.
MACD (Moving Average Convergence Divergence):
- The MACD line is above the signal line, and the histogram shows positive values, indicating bullish momentum. The MACD is also above the zero line, confirming the uptrend.
Volume:
- Volume spikes confirm the strength of price movements. Higher volumes on up moves indicate strong bullish interest.
Stochastic Oscillator:
- The Stochastic Oscillator is at 89.36, indicating an overbought condition. Readings above 80 suggest the potential for a pullback.
NZD/USD Critical Support and Resistance Levels
Resistance Levels:
- 0.6225: The recent high within the ascending channel.
- 0.6280: Next significant resistance level if the current high is breached.
Support Levels:
- 0.6100: Lower bound of the ascending channel and previous support level.
- 0.6025: Near the middle of the ascending channel, the previous resistance turned to support.
NZDUSD Forecast and Possible Price Targets
Bullish Scenario:
- If the price continues to hold above the 50-period SMA, the Ichimoku Cloud, and within the ascending channel, we could see a retest of the immediate resistance at 0.6225. A breakout above this level could target the next resistance at 0.6280. Sustained bullish momentum could aim for the psychological level of 0.6300 and potentially higher towards 0.6350.
Bearish Scenario:
- If the price fails to hold above the 50-period SMA, the ascending channel, and the Ichimoku Cloud, we could see a decline toward the immediate support at 0.6100. A breakdown below this level could target the lower support at 0.6025. Further, bearish momentum could be seen in the price retesting at the 0.6000 level.
Conclusion
The NZD/USD pair shows bullish momentum in the short term, supported by the ascending channel, price trading above the 50-period SMA, and the Ichimoku Cloud. Key levels to watch include 0.6225 (resistance) and 0.6100 (support). A breakout above resistance could target higher levels, while a breakdown below support could see the price revisiting lower levels.
The additional indicators (Bollinger Bands, Ichimoku Cloud, MACD, Volume, and Stochastic Oscillator) provide a comprehensive view, confirming bullish momentum and indicating overbought conditions that could lead to a pullback. Traders should monitor these levels and the behavior of the indicators for further confirmation of the trend.


