GBPUSD Analysis – 24-June-2024
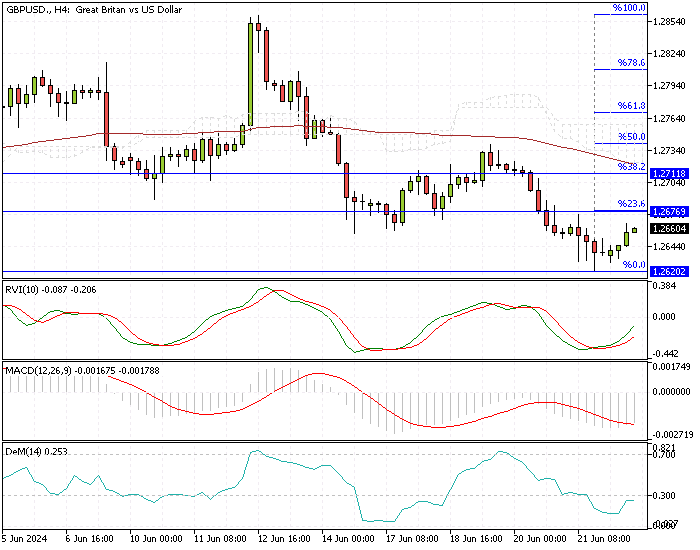
The GBP/USD currency pair recently experienced a notable pullback, dropping below 1.267 on June 20. Currently, the pair is trading around 1.265, slightly recovering from June’s low of 1.262.
GBPUSD Analysis – 24-June-2024
GBPUSD Technical Analysis – 24-June-2024
A critical tool in predicting this pullback was the DeMarker indicator. This technical indicator, currently below the 0.3 line, signals oversold conditions, suggesting that the recent decline might be overstretched and due for a reversal.
In this context, watching for key resistance and support levels is crucial. The immediate resistance level is at the 23.6% Fibonacci retracement level, the 1.267 mark. If buyers (or bulls) push the price above 1.267, it could rise further to test the 75-period simple moving average on the 4-hour chart. This level is also supported by the Ichimoku Cloud, a popular technical analysis tool that helps identify trends and reversals.
Bearish Scenario
On the downside, the price must remain below the Ichimoku Cloud to sustain the downtrend. Additionally, the U.S. dollar must fall below the immediate support level of 1.262 against the pound sterling.
Summary
Understanding these levels and indicators can help traders make informed decisions. Monitoring these signals can provide insights into potential price movements and assist strategic trading planning.