USDJPY Analysis – 4-June-2024
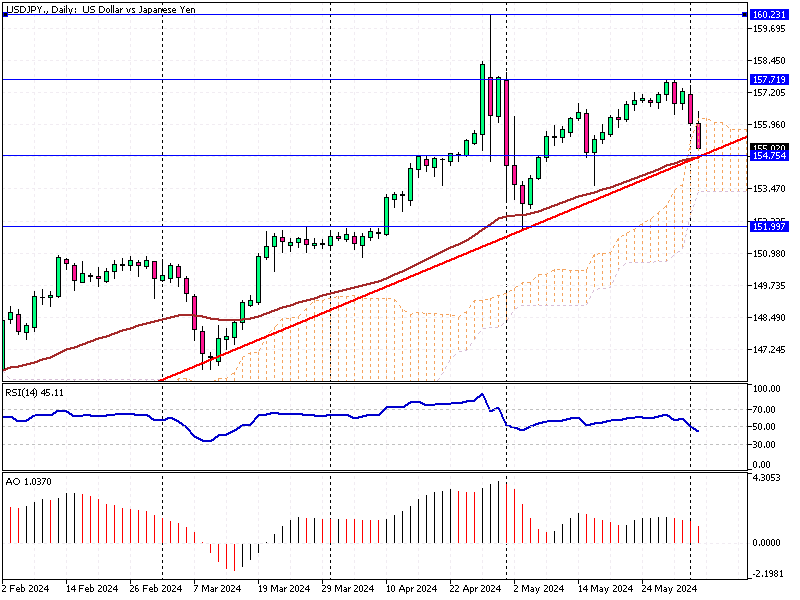
The USD/JPY currency pair has declined from $157.7 and is testing the ascending trendline at $154.7. In conjunction with the Ichimoku cloud and the April 9 high, this demand area suggests a potential zone of support that traders should closely monitor.
Technical Analysis and Indicators:
The technical indicators signify a bearish profile.
- RSI (Relative Strength Index): The RSI value is 45, below the neutral 50 mark and declining. An RSI value below 50 typically indicates bearish momentum, and a further drop below 30 could signal that the pair is oversold, potentially prompting a reversal.
- Awesome Oscillator: The value is 1.04, hovering above the signal line but declining. This indicator measures market momentum, and a declining value suggests that the bullish momentum is weakening, which could lead to a bearish crossover if it dips below the signal line.
USDJPY Key Technical Levels to Watch
USDJPY Analysis – 4-June-2024
From a technical standpoint, the primary trend remains bullish. However, to ensure the uptrend continues, the bulls must maintain the price above the ascending trendline and the immediate support at $154.7. If this scenario unfolds, the USD/JPY will likely surge to retest the key resistance level at $157.7.
Traders should look for confirmation through bullish candlestick patterns or an increase in volume to validate the continuation of the uptrend.
Conversely, if the bears close the USD/JPY price below the ascending trendline and the immediate support at $154.7, the next bearish target will likely be $151.9. This level could serve as a potential support zone where buyers might step in, but a breach below this level could signal a deeper correction.
Trading Strategies
For Bullish Traders:
- Entry Point: Consider entering a long position if the price bounces off the $154.7 support level and shows signs of a bullish reversal, such as a bullish engulfing pattern or a hammer candlestick.
- Target: Aim for a retest of the $157.7 resistance level.
- Stop-Loss: Place a stop-loss order below the $154.7 support to manage risk effectively.
For Bearish Traders
- Entry Point: Look for a short position if the price breaks and closes below the $154.7 support level, confirming a bearish trend.
- Target: The next target would be the $151.9 support level.
- Stop-Loss: Set a stop-loss order above today’s peak at $156.4 to protect against a sudden reversal.
Additional Insights
- Ichimoku Cloud: The presence of the Ichimoku Cloud in conjunction with the support level adds significance to the $154.7 area. Traders should watch the cloud’s leading span lines for additional support and resistance cues.
- Economic Indicators: Keep an eye on upcoming economic data releases, such as U.S. non-farm payrolls or Japanese GDP figures, which could impact the USD/JPY pair. Economic surprises can lead to increased volatility and present trading opportunities.
- Sentiment Analysis: Market sentiment can provide valuable context. Monitor the Commitment of Traders (COT) reports and other sentiment indicators to gauge the positioning of major market participants.
By incorporating these strategies and insights, traders can make more informed decisions when trading the USD/JPY pair. It is essential to remain vigilant and adaptable, as market conditions can change rapidly.