GBPUSD Analysis – May-29-2024
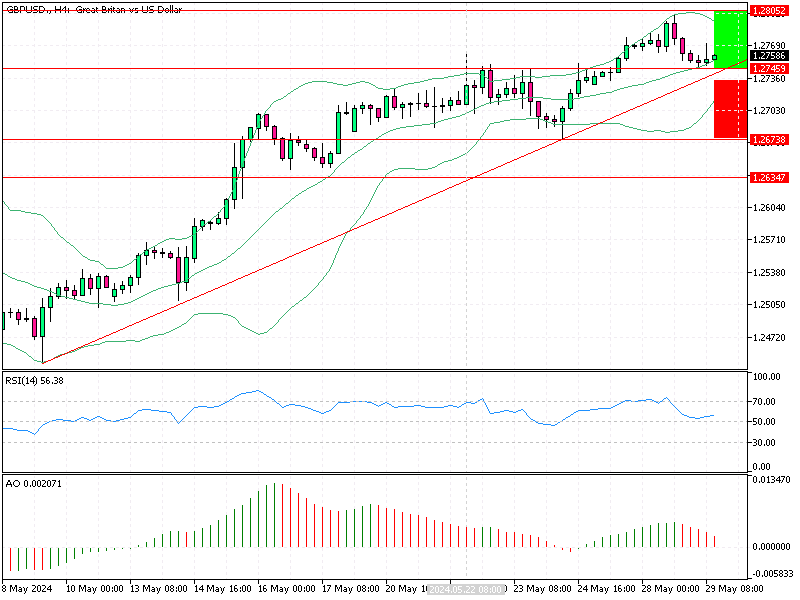
The GBP/USD currency pair dipped from the 1.280 high today, and as of this writing, the price is testing the $1.275 immediate support.
GBPUSD Analysis – May-29-2024

GBPUSD Analysis – May-29-2024
This resistance level is backed by the middle band of Bollinger and the May 22 high.
- The awesome oscillator signals divergence, meaning the trend could reverse or consolidate.
- The RSI indicator value is 56, approaching the 50 lines, suggesting the uptick momentum is weakening.
Bullish Scenario
From a technical standpoint, while the technical indicators suggest a bearish trend might be imminent, the price hovers above the ascending trendline. Hence, for the primary bullish trend to resume, the price must remain above the ascending trendline.
In this scenario, the bull’s first target is 1.280, and with more buying pressure, the price will likely head toward $1.289.
Bearish Scenario
On the flip side, if the GBP/USD price dips below the immediate resistance at 1.274, the decline will likely test the 1.267 support, followed by the $1.263.


