EURUSD Technical Analysis: The Bullish Keys
On November 14, the EURUSD pair witnessed a significant uptrend, evidenced by a long-bodied bullish candle. This pattern clearly highlights a strong bullish bias taking hold of the market, the trend further supported by the Ichimoku cloud. Currently, the EURUSD price is not only stabilizing above the cloud but is also challenging the 50% Fibonacci retracement level. The key observation in this EURUSD technical analysis is the broken bullish trendline, now providing support to the upward momentum. With the price maintaining above this trendline, there is a heightened anticipation among bulls to reach the 61.8% Fibonacci retracement level.
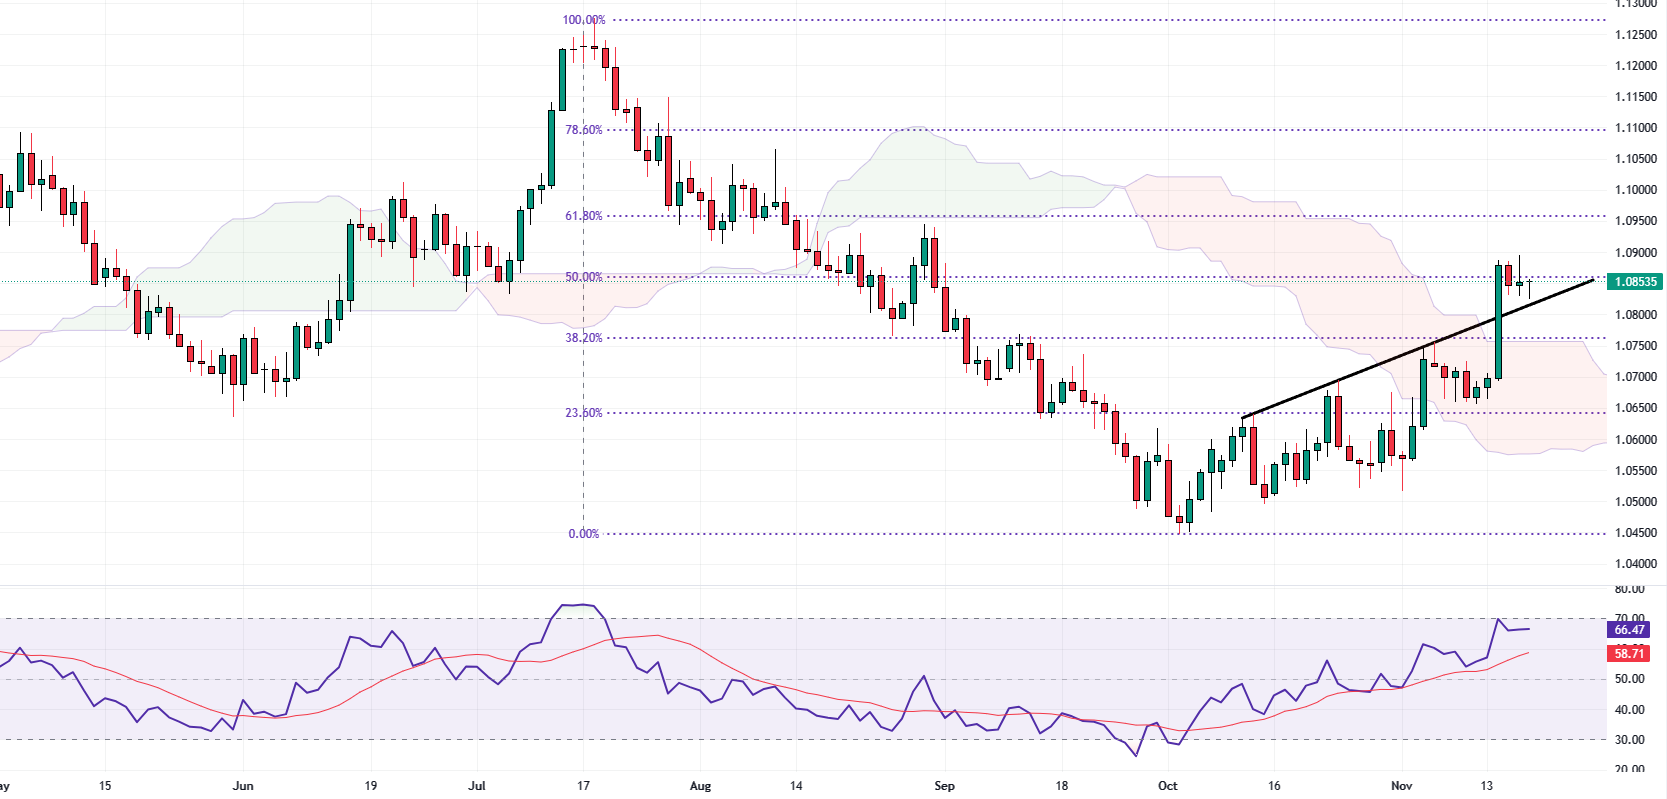
EURUSD Technical Analysis – 4H Chart
However, should the price fall below the trendline, a corrective movement towards the 38.2% Fibonacci level might unfold. Despite this potential downside, the overall market trend remains bullish as long as the EURUSD price stays above the Ichimoku cloud, offering a positive outlook for traders and investors.